The Deere & Company (NYSE: DE) Board of Directors declared a regular quarterly dividend of $0.35 a share on common stock, $1.40 annualized.
The dividend is payable May 2, 2011, to stockholders of record on March 31, 2011. The ex-dividend date is March 29, 2011.
Yield on the dividend is 1.6%.
Disclosure I am Long DE shares.

Thursday, February 24, 2011
Seadrill (SDRL) Increases Quarterly Dividend to $0.675; Yields 7.3%; Declares Special $0.20 Dividend
Seadrill (Nasdaq: SDRL) has declared a quarterly dividend of $0.675 per common share, $2.70 annualized. The dividend is a 44.4% increase from the current rate of $0.4675.
Yield on the dividend is 7.3%.
The Board also declared a special dividend of $0.20 per share.
Yield on the special dividend is 0.5%.
Disclosure I am Long SDRL shares.
Yield on the dividend is 7.3%.
The Board also declared a special dividend of $0.20 per share.
Yield on the special dividend is 0.5%.
Disclosure I am Long SDRL shares.
Colgate-Palmolive (CL) Increases Quarterly Dividend 9% to $0.58
Colgate-Palmolive Company (NYSE: CL) has declared a quarterly dividend of $0.58 per common share, $2.32 annualized. The dividend is a 9% increase from the current rate of $0.53.
The dividend is to be paid on May 16, 2011 to shareholders of record as of April 26, 2011. The ex-dividend date is April 22, 2011.
Yield on the dividend is 3%.
Disclosure none.
The dividend is to be paid on May 16, 2011 to shareholders of record as of April 26, 2011. The ex-dividend date is April 22, 2011.
Yield on the dividend is 3%.
Disclosure none.
Monday, February 21, 2011
In Bull Markets, Utility ETFs Still Have Benefits
Although the stock market has come back strong, you’ve still got good reason to think about utility exchange traded funds (ETFs) and the benefits they can offer any portfolio.
The electric utilities sector holds many dividend plays that will help cushion a growth portfolio from its occasional dips, writes YCharts for iStockAnalyst. As the the market makes gains, investors pull money out of utilities for riskier plays, which has left many utilities undervalued.
Disclosure I am long XLU shares.
The electric utilities sector holds many dividend plays that will help cushion a growth portfolio from its occasional dips, writes YCharts for iStockAnalyst. As the the market makes gains, investors pull money out of utilities for riskier plays, which has left many utilities undervalued.
- Utilities are safe, no-surprise plays. These companies used to operate as government-endorsed monopolies that control the whole chain of production through distribution. Now, deregulated electric utilities are competing for customers, and many operate in non-regulated businesses, like trading energy futures or building power plants on speculation. As a result, utilities may cut their dividends since earnings didn’t meet expectations.
- For the investors who are still looking to utilities, a company’s willingness and ability to consistently payout dividends are among the top draws.
- Utility ETFs are experiencing an influx in interest from boomers as they make the transition to fixed-income investments for their retirements, according to the Wall St. Cheat Sheet. Rising energy consumption and a stronger economy also adds strength to the utilities sector.
- Utilities Select Sector SPDR Fund (NYSEArca: XLU). XLU is highly liquid and a good way to diversify into U.S. utilities. It also boasts a 4.7% dividend.
- iShares S&P Global Utilities Sector Index Fund (NYSEArca: JXI). JXI is a global utilities play. Though not as liquid, the fund could better be served as a long-term play. It has a respectable 2.95% dividend.
- First Trust NASDAQ Smart Grid Infrastructure (NASDAQ: GRID). GRID provides exposure to the clean-energy utilities plays. It should be noted that the fund does trade at a rather low volume.
- ProShares Ultra Utilities Fund (NYSEArca: UPW). UPW is a leveraged 2x daily bull, maximizing the daily moves of the underlying index.
- ProShares UltraShort Utilities Fund (NYSEArca: SDP). SDP is a leveraged 2x daily bear, a good way to play the sector if it falters short- or long-term.
Disclosure I am long XLU shares.
PowerShares to Change Tickers on Small-Cap ETFs
Invesco PowerShares and Select Sector SPDRs have reached a deal that would further differentiate their lineup of sector exchange traded funds (ETFs)
A settlement has been reached under which PowerShares will voluntarily change the ticker symbols of its nine S&P SmallCap Sector ETFs. The changes are aimed at making the PowerShares S&P SmallCap Sector ETF tickers more distinguishable from the Select Sector SPDR tickers.
The PowerShares SmallCap Sector ETFs will begin trading under the new tickers in late March 2011; everything else about the funds will remain the same. The new tickers are as follows:
Disclosure NONE.
A settlement has been reached under which PowerShares will voluntarily change the ticker symbols of its nine S&P SmallCap Sector ETFs. The changes are aimed at making the PowerShares S&P SmallCap Sector ETF tickers more distinguishable from the Select Sector SPDR tickers.
The PowerShares SmallCap Sector ETFs will begin trading under the new tickers in late March 2011; everything else about the funds will remain the same. The new tickers are as follows:
- Consumer Discretionary was XLYS, will become PSCD
- Consumer Staples was XLPS, will become PSCC
- Energy was XLES, will become PSCE
- Financials was XLFS, will become PSCF
- Health Care was XLVS, will become PSCH
- Industrials was XLIS, will become PSCI
- Information Technology was XLKS, will become PSCT
- Materials was XLBS, will become PSCM
- Utilities & Telecom Services was XLUS, will become PSCU
Disclosure NONE.
Semiconductor ETFs Power Up
Semiconductor exchange traded funds (ETFs) are getting a boost from sector component Micron (NYSE: MU), but the sector may face headwinds as the short sellers and technicalities are a factor.
The semiconductor sector is doing better than it has in more than three years, but some worry that it may be nearing a top. Some analysts forecast that any pullback in the market might spark a sell-off in semis, reports Rodrigo Campos for Reuters. For now, though, the markets are flying high and we’re coming off a strong earnings season.
That often bodes well for semiconductors, beneficiaries of increased corporate IT spending.
Earlier this week the sector did get a shot of strength as shares of Micron are turning in one of the sector’s best performances, with the memory chip maker currently up by 3.8 %. Shares are on pace to close at their highest price since August of 2007, reports RTT staff writer for RTT News.
Is there a pullback in store? Maybe, but for now, you can’t deny that both SPDR S&P Semiconductor (NYSEArca: XSD) (of which Micron is 4.6%) and iShares PHLX SOXX Semiconductor (NYSEArca: SOXX) are more than 20% above their long-term trend lines.
Disclosure NONE.
Sunday, February 20, 2011
Reynolds American Boosts Quarterly Dividend 8.2% To 53 Cents
Reynolds American Inc. (RAI) raised its quarterly dividend 8.2% as the tobacco company, like many other companies of late, looks to return value to shareholders.
The company boosted the dividend to 53 cents from its previous 49-cent level, bringing the annual rate to $2.12 a share.
"This increase aligns the dividend with the company's recently increased payout target and demonstrates the company's commitment to returning value to shareholders," said President and Chief Executive-elect Daniel Delen.
Many companies have been looking to return value to shareholders in recent months, using their cash piles to buy back stock or implement or boost dividends.
Earlier this month, Reynolds said its fourth-quarter profit climbed 44%, driven by higher pricing and productivity improvements.
Shares rose 0.8% to $33.50 in light premarket trading. As of Tuesday's close, the stock had risen 29% in the past year.
Disclosure None
M&T Bank announces quarterly dividend of 70 cents MTB
M&T Bank Corp. said it will pay a regular quarterly dividend of 70 cents per share. The holding company for M&T Bank said that the dividend will be paid March 31 to shareholders of record as of Feb. 28. M&T, based in Buffalo, N.Y., has paid 70-cent quarterly dividends for at least a year. The company's banks had 739 offices in the mid-Atlantic region at the end of 2009.
M&T Bank Corporation operates as the holding company for M&T Bank and M&T Bank, National Association that provide commercial and retail banking services to individuals, corporations and other businesses, and institutions. It offers business loans and leases; business credit cards; deposit products, including savings deposits, time deposits, NOW accounts, and noninterest-bearing deposits; and financial services, such as cash management, payroll and direct deposit, merchant credit card, and letters of credit.
The company also provides residential real estate loans; multifamily commercial real estate loans; commercial real estate loans; residential mortgage loans; investment and trading securities; short-term and long-term borrowed funds; brokered certificates of deposit and interest rate swap agreements related thereto; and offshore branch deposits.
In addition, it offers foreign exchange services. Further, the company provides consumer loans, and commercial loans and leases; credit life, and accident and health reinsurance; and brokerage, investment advisory, and insurance agency services. As of December 31, 2009, it had 793 banking offices in New York State, Pennsylvania, Maryland, Delaware, New Jersey, Virginia, West Virginia, and the District of Columbia, as well as a branch in George Town, Cayman Islands. The company was founded in 1969 and is headquartered in Buffalo, New York.
Disclosure NONE.
Kilroy Realty Corporation (NYSE: KRC) Declared a regular quarterly cash dividend of $0.35
Kilroy Realty Corporation (NYSE: KRC) announced today that its board of directors declared a regular quarterly cash dividend of $0.35 per common share payable on April 15, 2011 to stockholders of record on March 31, 2011. The dividend is equivalent to an annual rate of $1.40 per share. The board of directors also declared a dividend of $0.4875 per share on the company’s 7.80% Series E Cumulative Redeemable Preferred Stock for the period commencing on and including February 15, 2011 and ending on and including May 14, 2011. The dividend will be payable on May 16, 2011 to Series E preferred stockholders of record on April 29, 2011.
The board of directors also declared a dividend of $0.46875 per share on the company’s 7.50% Series F Cumulative Redeemable Preferred Stock for the period commencing on and including February 15, 2011 and ending on and including May 14, 2011. The dividend will be payable on May 16, 2011 to Series F preferred stockholders of record on April 29, 2011.
Kilroy Realty Corporation, a member of the S&P Small Cap 600 Index, is a real estate investment trust active in the premier office and industrial submarkets along the West Coast. For over 60 years, the company has owned, developed, acquired and managed real estate assets primarily in the coastal regions of Los Angeles, Orange County, San Diego, greater Seattle and the San Francisco Bay Area. At December 31, 2010, the company owned 10.4 million rentable square feet of commercial office space and 3.6 million rentable square feet of industrial space. More information is available at www.kilroyrealty.com.
T. Rowe Price Raises Dividend
T. Rowe Price Group, Inc.’s (TROW - Analyst Report) board of directors approved a 15.0% hike in the company’s quarterly common stock dividend on Thursday. The revised quarterly dividend now stands at 31 cents per share compared with the previous amount of 27 cents. The revised dividend will be payable on March 29, to shareholders as of the close of business on March 15.
This marks T. Rowe’s 25th consecutive annual dividend increase, reflecting the company’s commitment to return value to shareholders with its strong cash generation capabilities. Prior to this revision, the company increased its dividend by 8% (from 25 cents to 27 cents per share) in February 2010.
Based in Baltimore, T. Rowe Price is a global investment management organization with $482.0 billion in assets under management (AUM) as of December 31, 2010. The organization provides a broad array of mutual funds, subadvisory services, and separate account management for individual and institutional investors, retirement plans and financial intermediaries. The company also offers refined investment planning and guidance tools.
We believe that despite active competition in markets, the company has a significant long-term upside potential based on its disciplined risk-aware investment approach which focuses on diversification, style consistency and fundamental research.
As of December 31, 2010, T. Rowe Price remains debt-free with substantial liquidity, including cash and mutual fund investment holdings of about $1.5 billion, which supports the company’s ability to continue investing for the future periods.
In 2010, the company paid roughly $278.9 million in dividends to common shareholders. Cash and cash equivalents exiting the year were $813.1 million. The company had $732.8 million in operating cash flows compared with $535.6 million as of December 31, 2009.
Earnings Recap
T. Rowe Price’s fourth-quarter 2010 earnings of 72 cents per share were significantly up from 57 cents reported in the prior-year quarter. Higher-than-expected results and better AUM were partially offset by increase operating expenses. Earnings for the quarter also surpassed the Zacks Consensus Estimate of 69 cents.
Based on its current strategic projects and plans, T. Rowe Price expects capital expenditures for fiscal 2011 to be approximately $120 million for property and equipment additions. The company anticipates funding these cash expenditures from internal resources.
Nevertheless, fundamentals remain strong with a debt-free position, higher return on earnings and improving investor sentiment. Further, relative mutual fund performance was also positive and we believe that in the long run, the company’s financial stability has the potential to take advantage of the gaining traction in the economy and benefit from the growth opportunities in the domestic and global AUM.
Moreover, the dividend increase reflects T. Rowe Price’s strong cash position and shareholders’ value to the company.
Disclosure None.
NextEra Energy Increases Quarterly Dividend 10% to 55 Cents
NextEra Energy Inc. (NEE) boosted its quarterly dividend by 10%, the latest company making a move to return cash to shareholders.
The company, which serves 4.5 million customers as Florida's largest utility company and is also the largest renewable energy provider in the U.S., raised the dividend by a nickel to 55 cents a share. It's payable on March 15 to shareholders of record on March 4.
A number of companies have been boosting or implementing dividends lately, looking to return value to shareholders as they dwindle cash piles built up during the recession.
NextEra last month said its third-quarter profit dropped 25% as sales and margins declined and usage at its electric utility decreased due to weather.
Shares recently increased 0.4% to $54.45. The stock has risen 19% in the past year.
Disclosure None.
Rogers Communication (RCI.B) increased dividends by 10%
Rogers Communication (RCI) increased dividends by 10% this week bringing their dividends to $0.355 and a yield of 4.07%. Rogers is a Canandian Dividend Aristocrat and continues to reward investors. I do not hold a position in Rogers but it is on my short list and is trading near the bottom of its 52-week low.
TransCanada Corporation (TRP), another Canadian Dividend Aristocrat, also increased its dividend after a quarter that exceeded expectations. The increase of 2 cents, for a total of $0.42 per quarter, represent a 5% increase and provides TRP with a 4.42% dividend yield.
Disclosure NONE.
TransCanada Corporation (TRP), another Canadian Dividend Aristocrat, also increased its dividend after a quarter that exceeded expectations. The increase of 2 cents, for a total of $0.42 per quarter, represent a 5% increase and provides TRP with a 4.42% dividend yield.
Disclosure NONE.
Cashing in on the smartphone craze New FONE ETF Debuts
Love ETFs? Love your smartphone? Well break out your iPhone, Droid or BlackBerry. Starting today, you can buy a smartphone ETF.
First Trust Portfolio launched the new ETF on Friday under the ticker FONE (FONE). It lists Samsung, Motorola Mobility (MMI) and Nokia among its major holdings. And experts are giving it a thumbs up.
"It's not heavily invested in just a few stocks," said Tom Lydon, president of Global Trends Investments and editor of ETFTrends.com. "It's pretty broadly diversified."
About a quarter of the ETF includes semiconductors, with another 23% dominated by communications equipment.
But the rest is spread out pretty well among electronic equipment, wireless services and others. And some of the bigger names aren't included among the top 10.
There's no Apple (AAPL), AT&T (T), Verizon (VZ) or Google (GOOG) among the ETF's top 10 holdings, which Lydon says "bodes well for how this index was constructed." But those names are part of both the index and the ETF, which have a total of 72 components.
The smartphone ETF is clearly a niche-y product. It's unlikely that big institutional investors will snap it up. But that might be exactly what retail investors are hungering for.
"Some of these companies are huge," said Rick Ferri, investment adviser at Portfolio Solutions.
The ETF comes less than a year after Nasdaq launched the NasdaqOMX CEA Smartphone Index (QFON). Since its debut in April 2010, the index has gained more than 19%.
Still, it's worth noting that this is roughly in line with how the PowerShares QQQ (QQQQ) ETF, which tracks the Nasdaq-100 and holds many of the same stocks, has done.
So investors don't necessarily need to buy the FONE ETF to cash in on the mobile craze.
Disclosure NONE.
First Trust Portfolio launched the new ETF on Friday under the ticker FONE (FONE). It lists Samsung, Motorola Mobility (MMI) and Nokia among its major holdings. And experts are giving it a thumbs up.
"It's not heavily invested in just a few stocks," said Tom Lydon, president of Global Trends Investments and editor of ETFTrends.com. "It's pretty broadly diversified."
About a quarter of the ETF includes semiconductors, with another 23% dominated by communications equipment.
But the rest is spread out pretty well among electronic equipment, wireless services and others. And some of the bigger names aren't included among the top 10.
There's no Apple (AAPL), AT&T (T), Verizon (VZ) or Google (GOOG) among the ETF's top 10 holdings, which Lydon says "bodes well for how this index was constructed." But those names are part of both the index and the ETF, which have a total of 72 components.
The smartphone ETF is clearly a niche-y product. It's unlikely that big institutional investors will snap it up. But that might be exactly what retail investors are hungering for.
"Some of these companies are huge," said Rick Ferri, investment adviser at Portfolio Solutions.
"You're not getting a really pure play on smartphones."
The ETF comes less than a year after Nasdaq launched the NasdaqOMX CEA Smartphone Index (QFON). Since its debut in April 2010, the index has gained more than 19%.
Still, it's worth noting that this is roughly in line with how the PowerShares QQQ (QQQQ) ETF, which tracks the Nasdaq-100 and holds many of the same stocks, has done.
So investors don't necessarily need to buy the FONE ETF to cash in on the mobile craze.
Disclosure NONE.
American Water (NYSE:AWK) Declares Quarterly Dividend
American Water Works Company, Inc. (NYSE:AWK) announced today that its Board of Directors declared a quarterly cash dividend payment of $0.22 per share. The regular quarterly cash dividend is payable on March 1, 2011 to all shareholders of record as of February 18, 2011.
"We are pleased to declare our first dividend of 2011," said Jeff Sterba, president and CEO of American Water. "American Water has a long history of paying consecutive dividends and we are glad to continue this tradition as we enter the New Year."
American Water offers a dividend reinvestment and direct stock purchase plan called American Water Stock Direct, which enables stockholders to reinvest cash dividends and purchase additional American Water common shares without any brokerage commissions or service charges. Stockholders and other persons may obtain a copy of the Plan prospectus and an enrollment form by contacting American Stock Transfer & Trust Company ("AST") at (888) 556-0423 or visiting AST's website at www.amstock.com.
This press release shall not constitute an offer to sell or the solicitation of an offer to buy any securities. The offer is being made solely through the Plan prospectus.
Founded in 1886, American Water is the largest investor-owned U.S. water and wastewater utility company. With headquarters in Voorhees, N.J., the company employs more than 7,000 dedicated professionals who provide drinking water, wastewater and other related services to approximately 15 million people in more than 30 states and parts of Canada.
Disclosure I am Long AWK shares.
Top 10 Large Cap Stocks with Highest Dividend Yield: SDRL, CTL, TEF, LO, STD, RAI, MO, T, NGG, NOK (Feb 20, 2011)
Below are the top 10 Large Cap stocks with highest dividend yields for the last 12 months,
SeaDrill Limited (NYSE:SDRL) has the 1st highest dividend yield in this segment of the market. Its current dividend yield is 7.10%. Its dividend payout ratio was 62.61% for the last 12 months.
CenturyLink, Inc. (NYSE:CTL) has the 2nd highest dividend yield in this segment of the market. Its current dividend yield is 7.03%. Its dividend payout ratio was 93.03% for the last 12 months.
Telefonica S.A. (ADR) (NYSE:TEF) has the 3rd highest dividend yield in this segment of the market. Its current dividend yield is 6.81%. Its dividend payout ratio was 63.09% for the last 12 months.
Lorillard Inc. (NYSE:LO) has the 4th highest dividend yield in this segment of the market. Its current dividend yield is 6.54%. Its dividend payout ratio was 62.74% for the last 12 months.
Banco Santander, S.A. (ADR) (NYSE:STD) has the 5th highest dividend yield in this segment of the market. Its current dividend yield is 6.27%. Its dividend payout ratio was 36.77% for the last 12 months.
Reynolds American, Inc. (NYSE:RAI) has the 6th highest dividend yield in this segment of the market. Its current dividend yield is 6.13%. Its dividend payout ratio was 80.72% for the last 12 months.
Altria Group, Inc. (NYSE:MO) has the 7th highest dividend yield in this segment of the market. Its current dividend yield is 6.13%. Its dividend payout ratio was 78.28% for the last 12 months.
AT&T Inc. (NYSE:T) has the 8th highest dividend yield in this segment of the market. Its current dividend yield is 6.02%. Its dividend payout ratio was 52.33% for the last 12 months.
National Grid plc (ADR) (NYSE:NGG) has the 9th highest dividend yield in this segment of the market. Its current dividend yield is 6.00%. Its dividend payout ratio was 65.45% for the last 12 months.
Nokia Corporation (ADR) (NYSE:NOK) has the 10th highest dividend yield in this segment of the market. Its current dividend yield is 5.93%. Its dividend payout ratio was 80.97% for the last 12 months.
Disclosure I am Long SDRL, STD and CTL shares.
Dividend Investing KMP Master Limited Partnership
Dividend Investing KMP or inside ya Ira KMR
So many investments to consider, so little time --- I stumbled across this gem recently (this morning).
From Kinder Morgan’s company website:
“Kinder Morgan owns or operates approximately 37,000 miles of pipelines and 180 terminals in North America. Our companies include Kinder Morgan Energy Partners, L.P. (NYSE: KMP), Kinder Morgan Management, LLC (NYSE: KMR) and Kinder Morgan, Inc., a private company which owns the general partner of KMP.
Kinder Morgan has a large footprint of diversified and strategically located assets, and we are a market leader in most of our businesses. For example, in North America, we are:
We have been executing the same strategy since 1997. Our business model is simple. We own, operate, expand, build and acquire primarily midstream energy assets that provide a return substantially in excess of our capital costs, and then we distribute that excess to our limited partners and general partner.
We have minimal exposure to commodity price volatility because we typically don’t own the energy products that we transport, store or handle. As a result, our businesses are relatively stable and our fee-based assets have consistently generated superb cash flow in all types of market conditions. Where we do own the commodity, such as in our CO2 business, we hedge to lessen the impact of price swings.
Our business model has worked well and KMP has delivered a compound average annual return of 25 percent to unitholders over the past 12 years. In addition to delivering value to our unitholders, our focus is on operating our assets safely to protect the public and the environment. We spend millions of dollars each year on integrity management programs and maintenance to operate our assets safely.
At Kinder Morgan, we pride ourselves on being a different kind of energy company. What makes us different?
It starts at the top with Chairman and CEO Richard D. Kinder, who earns a salary of $1 per year and does not receive a bonus, stock options or restricted stock grants. As a shareholder/unitholder, Kinder’s financial rewards are directly aligned with the company’s investors – if the company does well, he does well.
We also eliminate unnecessary overhead expenses such as corporate aircraft, sponsorships, sports tickets and executive perks. In addition, we cap senior executives’ base salaries far below industry standards. Their financial incentives, such as bonuses, are tied directly to the performance of the company and their own personal performances.
Kinder Morgan has been conducting its business transparently long before it became a corporate buzz word. To our knowledge, we are the only S&P 500 company that publishes its annual budget on its web site, which enables investors and others to follow our progress throughout the year. We also post our environmental, health and safety (EHS) performance on our web site. KMP continues to outperform the industry averages in most EHS categories.
Kinder Morgan does not have a Political Action Committee (PAC), nor do we make any political contributions. Any political contributions made by executives or employees are made individually as private citizens with their own personal money. KMR is a limited partner in and manages and controls the business and affairs of KMP. KMR has no properties and its success is dependent upon its operation and management of KMP and KMP's resulting performance.
KMI owns the general partner and limited partner units in KMP. KMI also owns 20 percent of and operates Natural Gas Pipeline Company of America (NGPL), which serves the high-demand Chicago market.
Kinder Morgan has approximately 8,000 employees.” www.kne.com
Holy cow is this company for real! Lets see if they put their money where their mouth is. The stock is trading at $72.47 and has been upward trending since 2009. 52 week low was at around $63. They have also increased the quarterly dividend from $1.07 to $1.13 in the past year. KMR has a solid history of dividend increases. Not only that but their net profit margin is 15.38%.
Current dividend yield is 6.24%. I don’t see any downside to owning this stock. Pipelines wear out and need upgrading and replacement over the years but they are actively accomplishing this too. Put this in my “THUMBS UP” category.
Disclaimer I plan to purchase KMR down the road.
So many investments to consider, so little time --- I stumbled across this gem recently (this morning).
From Kinder Morgan’s company website:
“Kinder Morgan owns or operates approximately 37,000 miles of pipelines and 180 terminals in North America. Our companies include Kinder Morgan Energy Partners, L.P. (NYSE: KMP), Kinder Morgan Management, LLC (NYSE: KMR) and Kinder Morgan, Inc., a private company which owns the general partner of KMP.
Kinder Morgan has a large footprint of diversified and strategically located assets, and we are a market leader in most of our businesses. For example, in North America, we are:
- The largest independent transporter of refined petroleum products
- One of the largest natural gas transporters and storage operators
- The largest independent terminal operator
- The largest transporter and marketer of CO2
- The largest handler of petroleum coke
We have been executing the same strategy since 1997. Our business model is simple. We own, operate, expand, build and acquire primarily midstream energy assets that provide a return substantially in excess of our capital costs, and then we distribute that excess to our limited partners and general partner.
We have minimal exposure to commodity price volatility because we typically don’t own the energy products that we transport, store or handle. As a result, our businesses are relatively stable and our fee-based assets have consistently generated superb cash flow in all types of market conditions. Where we do own the commodity, such as in our CO2 business, we hedge to lessen the impact of price swings.
Our business model has worked well and KMP has delivered a compound average annual return of 25 percent to unitholders over the past 12 years. In addition to delivering value to our unitholders, our focus is on operating our assets safely to protect the public and the environment. We spend millions of dollars each year on integrity management programs and maintenance to operate our assets safely.
At Kinder Morgan, we pride ourselves on being a different kind of energy company. What makes us different?
It starts at the top with Chairman and CEO Richard D. Kinder, who earns a salary of $1 per year and does not receive a bonus, stock options or restricted stock grants. As a shareholder/unitholder, Kinder’s financial rewards are directly aligned with the company’s investors – if the company does well, he does well.
We also eliminate unnecessary overhead expenses such as corporate aircraft, sponsorships, sports tickets and executive perks. In addition, we cap senior executives’ base salaries far below industry standards. Their financial incentives, such as bonuses, are tied directly to the performance of the company and their own personal performances.
Kinder Morgan has been conducting its business transparently long before it became a corporate buzz word. To our knowledge, we are the only S&P 500 company that publishes its annual budget on its web site, which enables investors and others to follow our progress throughout the year. We also post our environmental, health and safety (EHS) performance on our web site. KMP continues to outperform the industry averages in most EHS categories.
Kinder Morgan does not have a Political Action Committee (PAC), nor do we make any political contributions. Any political contributions made by executives or employees are made individually as private citizens with their own personal money. KMR is a limited partner in and manages and controls the business and affairs of KMP. KMR has no properties and its success is dependent upon its operation and management of KMP and KMP's resulting performance.
KMI owns the general partner and limited partner units in KMP. KMI also owns 20 percent of and operates Natural Gas Pipeline Company of America (NGPL), which serves the high-demand Chicago market.
Kinder Morgan has approximately 8,000 employees.” www.kne.com
Holy cow is this company for real! Lets see if they put their money where their mouth is. The stock is trading at $72.47 and has been upward trending since 2009. 52 week low was at around $63. They have also increased the quarterly dividend from $1.07 to $1.13 in the past year. KMR has a solid history of dividend increases. Not only that but their net profit margin is 15.38%.
Current dividend yield is 6.24%. I don’t see any downside to owning this stock. Pipelines wear out and need upgrading and replacement over the years but they are actively accomplishing this too. Put this in my “THUMBS UP” category.
Disclaimer I plan to purchase KMR down the road.
Digital Realty Trust Q4 FFO Rises; Forecast Boosted (DLR)
Data center REIT Digital Realty Trust, Inc. (DLR) on Friday posted better-than-expected fourth quarter funds from operations and lifted its full-year 2011 forecast.
The San Francisco-based company reported fourth quarter funds from operations (FFO) of $102.91 million, or 98 cents per share, compared with $69.43 million, or 79 cents per share, in the year-ago period. Excluding one-time items, adjusted FFO was 96 cents per share.
Revenue surged more than 40% from last year to $239 million.
On average, Wall Street analysts expected smaller FFO of 91 cents per share, albeit on higher revenue of $242 million.
Looking ahead, the company boosted its full-year 2011 FFO guidance to a range of $3.80 to $3.95 per share, while analysts expect $3.85 per share for the year.
Digital Realty Trust shares were mostly flat in premarket trading Friday.
The Bottom Line
We recently added shares of Digital Realty Trust (DLR) to our recommended list. The company has a 4.86% dividend yield, based on last night’s closing stock price of $56.02.
Disclosure None
Annaly Capital Still an “Outperform,” but Wary of Possible Dividend Cut (NLY)
Analysts at FBR Capital on Friday passed along some interesting opinions regarding real estate-related investment manager Annaly Capital Management, Inc. (NLY) on Friday.
Although the firm maintained its “Outperform” rating and $20 price target on NLY, it noted a dividend cut could be in the works for the company.
An FBR analyst commented, “We reiterate our rating and price target on NLY shares despite last week’s weaker-than-expected 4Q10 earnings results. While the results give us pause as to the viability of the current dividend, we believe that shares remain attractive from a long-term, risk-adjusted total return perspective. With a historically steep yield curve, the FOMC estimated to be on hold for at least another year, and declining prepayment speeds, we continue to believe that the operating environment is set up for NLY to deliver mid-to-high teen ROEs, and likewise dividend yields, for the foreseeable future.”
Annaly Capital shares were mostly flat in premarket trading Friday.
The Bottom Line
Shares of Annaly Capital (NLY) have a 14.29% dividend yield, based on last night’s closing stock price of $17.92. The stock has technical support in the $15-$17 price area. If the shares can firm up, we see overhead resistance around the $20 price level.
Disclosure I am Long NLY shares.
Earnings: National Health Investors up 20% NHI
National Health Investors (NYSE: NHI) announced today a 20 percent increase in its normalized funds from operations.
For the fourth quarter, NHI reported a Normalized FFO of $20 million, or 72 cents per basic share, compared to $16.7 million, or 60 cents per share, a year ago. The company reported Funds From Operations of $19.7 million, compared to $18.6 million for the year-ago quarter; and net income of $17 million, compared with $16.3 million in the year-ago quarter. Analysts, on average, had estimated earnings of 71 cents per share on an FFO of $20.1 million, according to Thomson Reuters.
Murfreesboro-based National Health Investors is a long-term health care real estate investment trust based in Murfreesboro. Its portfolio includes skilled nursing facilities, assisted living facilities, independent living facilities, medical office buildings and an acute care hospital.
Fourth quarter 2010 Normalized FFO: $20 million
Fourth quarter 2009 Normalized FFO: $16.7 million
Fourth quarter 2010 net income: $17 million
Fourth quarter 2009 net income: $16.3 million
Market reaction: NHI released it’s earnings report before the market opened Thursday. Shares closed Wednesday at $46.25. The 52-week range for the stock is $33.50 to $49.
National Health Investors, Inc., a real estate investment trust (REIT), invests in health care properties, primarily in the long-term care industry in the United States. As of December 31, 2008, it had investments in real estate assets and mortgage notes receivable investments in 123 health care facilities consisting of 83 long-term care facilities, 1 acute care hospital, 4 medical office buildings, 14 assisted living facilities, 4 retirement centers, and 17 residential projects for the developmentally disabled in 17 states. The company has elected to be treated as a REIT for federal income tax purposes and would not be subject to federal income tax, if it distributes at least 90% of its REIT taxable income to its shareholders. National Health Investors, Inc. was founded in 1991 and is based in Murfreesboro, Tennessee.
Disclosure I am long NHI shares.
National Health Investors, Inc. (NYSE: NHI) today declared a Dividend of $.6150 cents per share
National Health Investors, Inc. (NYSE: NHI) today declared a Dividend of $.6150 cents per share to shareholders of record on March 31, 2011 and payable on May 10, 2011.
National Health Investors, Inc (NYSE: NHI) has paid dividends since 1991 and has a current dividend yield of 5.1%.
National Health Investors, Inc’s current dividend information as per the date of this press release is:
Dividend Declaration Date: Feb-17-2011
Dividend Ex Date: Mar-29-2011
Dividend Record Date: Mar-31-2011
Dividend Payment Date: May-10-2011
Dividend Amount: 0.615
Disclosure I am long NHI shares.
Borders Declares Bankruptcy

The bankruptcy filing is horrible news for shareholders of the company. Long suffering shareholders will be wiped out for holding onto this stock. I never understood why anyone was investing in this stock. The long-term fundamentals were horrible. The writing had been on the wall for a long time at Borders. Amazon and the e-book frenzy have killed off most bookstore chains. The last company standing intact is Barnes & Noble.
Borders bankruptcy filing is however good news for the chain. The company is seeking to close 30% of its stores and has received access to $400 million of its $505 million bankruptcy financing from GE Capital. That’s roughly 193 of its 642 stores. Borders is now trying to change its business model by getting more into digital distribution and selling more non book products.
I still don’t see how Borders will reinvent itself. The company is years behind Amazon in the digital distribution game and remains behind Barnes and Noble in the traditional bookstore business. I just don’t think that the market is big enough for Borders to be a viable player.
Back in December of 2008, Borders Group was included in my post about Dead Companies Walking. Since that time Borders and Blockbuster have gone bankrupt. The next big chain that I expect too bankrupt is Rite Aid. The company is suffocating under its massive debt load. Rite Aid’s terrible same store sales numbers can only be explained away by management for so long.
What national chain do you expect to go belly up next?
Disclosure None
Fidelity Increases Commission-Free ETFs to 31
Consumers everywhere agree – price wars are the best wars on the planet. The ETF trading commission price war makes ETF investors happy and their wallets a little thicker. Fidelity today (2/16/11) announced the addition of five more iShares ETFs to its $0 commission lineup. This brings the total quantity of commission-free ETFs for Fidelity’s online customers to 31, consisting of Fidelity’s own Nasdaq Composite Tracking Stock (ONEQ) and 30 iShares products.
The complete list of iShares with free online trading at Fidelity now includes these ETFs:
The complete list of iShares with free online trading at Fidelity now includes these ETFs:
- iShares iBoxx Yield Corporate Bond (HYG)
- iShares Dow Jones Select Dividend (DVY)
- iShares Dow Jones EPAC Select Dividend (IDV)
- iShares Dow Jones Real Estate (IYR)
- iShares MSCI ACWI ex US (ACWX)
Schwab Creates Watershed Event with Commission-Free ETFs on 11/3/09 by launching its first ETFs and introducing commission-free trading. Schwab has since extended its lineup several times.
Fidelity responded three months later on 2/2/10 by teaming up with iShares to offer 26 Commission-Free ETFs at Fidelity while lowering commissions on other ETFs. Fidelity expanded its menu today.
Vanguard Entered the ETF Free Trading War three months later (5/4/10) by making its own line of ETFs available to Vanguard Brokerage customers without commissions. Vanguard continues to aggressively launch new ETFs with no commissions for its brokerage customers.
The Launch of Ameritrade’s ETF Supermarket on 10/8/10 was the most sweeping to date, including eight different sponsors and 101 ETFs and ETNs.
Disclosure I am Long HYG shares.
REIT ETFs: The Best of All Worlds?
If you’re on the market for an investment that’s been strong in recent months, kicks off nice dividends and, oh, also has relatively low risk, REIT exchange traded funds (ETFs) could be for you.
Real estate investment trusts, or REITs, generate some of the highest yields and were one of the best performers last year, writes David Fessler for InvestmentU. For instance, the Vanguard REIT ETF (NYSEArca: VNQ), which holds around 100 different REITs, gained 24% in 2010. The S&P 500, on the other hand, gained 12.8%.
Here’s the case for REITs:
Annaly Capital Management (NYSE: NLY) and American Capital Agency Corp. (NYSE: AGNC) are two REITs that stand out from the rest of the market, as stated by iStockAnalyst. Annaly owns, manages and finances real estate investments, with assets backed by Fannie Mae and Freddie Mac. Like Annaly, American Capital also holds securities backed by Fannie and Freddie, along with Ginnie Mae. REITs that don’t invest in government-backed securities usually carry higher implied risk and little or no difference in yields.
There are plenty of worth REIT funds to choose from; it only depends on what you’re willing to pay, what kind of yield you want and what corner of the REIT market most interests you.
Vanguard REIT ETF (NYSEArca: VNQ) has the second-best yield among REIT ETFs currently, at 4.2%. Half of the fund goes to retail REITs and specialized REITs, with smaller allocations going to office, residential and diversified REITS. It also has one of the lowest expense ratios among REIT funds: 0.10%.
Schwab U.S. REIT ETF (NYSEArca: SCHH) boasts a low 0.13% expense ratio. This ETF just launched. It’s made up of mortgage REITs, finance companies, commercial and residential real estate brokers, homebuilders and more.
SPDR Dow Jones REIT (NYSEArca: RWR) is the largest of all REIT ETFs, has a 3.3% yield a 0.20% expense ratio. Its holdings are primarily apartment, malls, office, health care and diversified REITs.
For more information on REITs, visit our REITs category.
Disclosure I am Long VNQ, AGNC, and NLY shares.
Real estate investment trusts, or REITs, generate some of the highest yields and were one of the best performers last year, writes David Fessler for InvestmentU. For instance, the Vanguard REIT ETF (NYSEArca: VNQ), which holds around 100 different REITs, gained 24% in 2010. The S&P 500, on the other hand, gained 12.8%.
Here’s the case for REITs:
- In a low interest rate environment, REITs do relatively well because they borrow money at low rates, buy high-interest, long-term assets and investors would profit from the spread. With unemployment just below 10%, zero inflation and “quantitative easing,” the low interest rate environment may stick around for a while longer.
- REITs are required by law to distribute 90% of taxable income to their shareholders, which gives investors a stable dividend yield.
- Recently, the Vanguard REIT index surged in activity as investors dived into the market on speculation of increased M&A activity, according to PR USA. Chatter on M&A activity rose when ProLogis confirmed that it was talking with rival AMB Property about a possible merger.
While dividends on REITs are rather attractive, note that companies may cut,slash or suspend dividends at anytime, with little or no notice.
Annaly Capital Management (NYSE: NLY) and American Capital Agency Corp. (NYSE: AGNC) are two REITs that stand out from the rest of the market, as stated by iStockAnalyst. Annaly owns, manages and finances real estate investments, with assets backed by Fannie Mae and Freddie Mac. Like Annaly, American Capital also holds securities backed by Fannie and Freddie, along with Ginnie Mae. REITs that don’t invest in government-backed securities usually carry higher implied risk and little or no difference in yields.
There are plenty of worth REIT funds to choose from; it only depends on what you’re willing to pay, what kind of yield you want and what corner of the REIT market most interests you.
Vanguard REIT ETF (NYSEArca: VNQ) has the second-best yield among REIT ETFs currently, at 4.2%. Half of the fund goes to retail REITs and specialized REITs, with smaller allocations going to office, residential and diversified REITS. It also has one of the lowest expense ratios among REIT funds: 0.10%.
Schwab U.S. REIT ETF (NYSEArca: SCHH) boasts a low 0.13% expense ratio. This ETF just launched. It’s made up of mortgage REITs, finance companies, commercial and residential real estate brokers, homebuilders and more.
SPDR Dow Jones REIT (NYSEArca: RWR) is the largest of all REIT ETFs, has a 3.3% yield a 0.20% expense ratio. Its holdings are primarily apartment, malls, office, health care and diversified REITs.
For more information on REITs, visit our REITs category.
Disclosure I am Long VNQ, AGNC, and NLY shares.
3 Approaches to Dividend ETF Investing

There are more than 30 dividend ETFs trading today (you can find them all on our ETF Analyzer), but they’re not all created equal.
Charles Lewis Sizemore for Benzinga reports that there are three different strategies to choose from to complement your investing goals:
- High dividend yield. Exposure to this type can be found in iShares Dow Jones Select Dividend Index (NYSEArca: DVY), which focuses on stocks that pay the highest current yields.
- High dividend growth rate. This kind of dividend can be found in Vanguard Dividend Appreciation ETF (NYSEArca: VIG). It looks beyond dividend yield, choosing stocks with a demonstrated history of rising dividends. Selection criteria differs from fund to fund.
- Dividend weighting. You can get this in WisdomTree LargeCap Dividend ETF (NYSEArca: DLN). DLN does not follow market-cap weighted strategy nor equal weight strategy for deciding the size of its respective stock positions; instead, it calculates the amount of cash each company pays in dividends and weights its portfolio accordingly.
MLP ETFs: A Fixed-Income Alternative
Are you looking for a stable and relatively high yield fixed-income asset? Then you may want to take a gander at master limited partnerships (MLPs) exchange traded funds (ETFs), which have only recently come to market.
If you’re unfamiliar with this sector, here’s the short of it: MLPs are a great way to play the energy industry with the added benefit of regular dividend payouts and investment appreciation.
Wells Fargo Senior Energy MLP Analyst Michael Blum believes that MLPs still have plenty of potential, with strong business fundamentals, distribution growth and attractive yields, writes Brian Sylvestor for Investor Ideas.
Those are the basics. Now here’s what you really need to know about this sector that’s more than likely new to you:
- There are different kinds of MLPs. Exploration and production (E&P) MLPs plays produce oil and natural while gather and processing (G&P) MLPs deal in extracted natural gas liquids (NGLs). G&P MLPs benefit from rising oil prices and low natural gas prices.
- Around 80% of distributions received from MLPs will be tax deferred until the asset is sold. MLPs are also equities, which means there is an upside in the price. Additionally, MLP distributions may change. Blum forecasts a 5% medium distribution growth for the MLP sector over the next couple of years.
- MLPs are slightly sensitive to interest rate changes – a spike in interest rates will cause MLPs to underperform, so watch for any hints of Federal Reserve action on that front. MLPs are also correlated to commodity prices, with a higher correlation toward rising crude oil – certainly an advantageous situation these days.
- Short-term bursts won’t affect MLPs too much because they operate based on volume of oil or natural gas shipped, which provide investors with predictable and stable cash flows, reports Jim Fink for Investing Daily.
- MLPs pay taxes at the partner, or unitholder, level and most of their income flow to their partners in the business, says Christine Benz for Morningstar. By gaining this tax status, MLPs must provide 90% of their income from “qualified sources,” or producing, processing, and transporting energy.
- Since MLP payouts aren’t dividends, investors report income on a K-1 form, as you would with futures-based ETFs.
- Alerian MLP ETF (NYSEArca: AMLP): AMLP launched last September, and it’s the first MLP ETF. Until this fund came along, MLP access could only be had in ETNs. It delivers a nice yield (currently close to 6%), though its performance has been flat since launch. This fund is diversified across three primary MLPs: petroleum transportation, natural gas pipelines and gathering and processing.
- Credit Suisse Cushing 30 MLP Index (NYSEArca: MLPN): MLPN owns 30 companies involved in the energy infrastructure market. Each holding in the fund starts off with a 3.33% weighting after rebalancing quarterly, making it a more equally-weighted fund instead of the more common route of cap-weighting.
- UBS E-TRACS Alerian Natural Gas MLP ETN (NYSEArca: MLPG): MLPG also appeared on the market in March 2010. It has a current yield of 6.23%. Its top 10 components range between 9.7% of the total portfolio (in the case of Enterprise Products Partners) down to 4.4% (in the case of MarkWest Energy Partners).
- JPMorgan Alerian MLP Index ETN (NYSEArca: AMJ): AMJ has a current yield of 5.04%. It’s a tad more concentrated than other MLP funds, however; the top two constituents account for more than 25% of the fund. If concentration is a concern for you, then you might be better off with an equally-weighted fund, or one that simply has its holdings spread out a little more.
Inflation Fears Weigh On ETFs, GLD,UUP,VGK,FXI
Exchange traded funds (ETFs) turned flat on Friday as investors reacted to fresh monetary tightening in China ahead of an eagerly-awaited Group of 20 finance meeting in Paris.
- After high-profile pledges to shake up the world monetary system and address the roots of the financial crisis, France has set seemingly modest goals for the two-day meeting of Group of 20 finance ministers and central bankers that begins Friday, economists said. The technical focus of the meeting, the first since France last month took over the year-long rotating presidencies of both the Group of Eight industrialized nations and the G20 in January, belies rising tensions over the issue of global imbalances and currency issues, economists said. The PowerShares DB U.S. Dollar Index Bullish ETF (NYSEArca: UUP) is flat in early trading.
- European stock markets edged lower Friday, with mining stocks under pressure after further tightening measures from China and bank stocks hit by profit-taking after recent gains. Joshua Raymond, market strategist at City Index, said the sector’s drop accelerated after China raised its reserve-requirement ratio, the second increase this year. “Whenever we’ve seen a move by China in their new tightening regime, there’s generally been a knee-jerk reaction in markets,” Raymond said. The Vanguard European ETF (NYSEArca: VGK) is flat in early trading.
- China ordered its banks Friday to hold back more money as reserves in a new move to curb lending and cool a spike in inflation. Beijing is using a series of repeated, gradual hikes in interest rates and reserve levels to stanch a flood of lending that helped China rebound quickly from the global crisis but now is fueling pressure for prices to rise. Inflation is politically dangerous for China’s communist leaders because it erodes economic gains on which they base their claim to power. Poor families are hit hardest in a society where some spend up to half their incomes on food and millions have seen little benefit from three decades of economic reform. The iShares FTSE/Xinhua China 25 (NYSEArca: FXI) is up modestly at the open.
- It’s a good day for metals. Gold rose and silver moved to a 30-year high, while palladium jumped to the highest price in almost 10 years on demand for precious metals to hedge against declines in other assets because of unrest in the Middle East. Gold bar and coin demand in the Middle East jumped 39% in the fourth quarter from a year earlier, according to World Gold Council figures released yesterday. “If you see violence, you would buy gold expecting that the domestics would buy gold,” said Peter Fertig, owner of Quantitative Commodity Research Ltd. in Hainburg, Germany. The SPDR Gold Shares ETF (NYSEArca: GLD) is trading flat on Friday.
Natural Gas ETFs Have a Tough Week
Futures-based natural gas exchange traded funds (ETFs) had a rough go of it last week. Is there any hope for a turnaround?
Maybe not anytime soon. Natural gas last week closed below $4, the lowest level in almost three months. That sank United States Natural Gas (NYSEArca: UNG) by nearly 10% and the newly-launched Teucrium Natural Gas (NYSEArca: NAGS) by 6.6% for the week.
That’s a sharp turnaround from the $13.50 level the fuel saw in the infamous summer of 2008, says The Fort-Worth Star Telegram. But like oil and gas, which also saw sky-high prices then, it swiftly and sharply reversed itself.
Despite the fact that more than 52% of households use natural gas for heat and a record snowfall across the country has them cranking up the furnaces, the market has a big surplus to work through. One encouraging sign is that supplies did fall more than expected last week, says FuturesPros.
A drilling boom in the sector could continue to pressure natural gas prices, although prices have now gotten so low that some companies wonder if the cost of drilling is worth it, says CNN.
Chesapeake Energy (NYSE: CHK) is one such company that abandoned plans to drill for natural gas; it’s 4.1% of First Trust ISE-Revere Natural Gas (NYSEArca: FCG). FCG has fared better lately; though it’s down 0.3% this week, it’s up 3.4% over the last 10 days.
This is one area that has a lot of sorting out left to do. Perhaps if some drillers step back from their efforts to extract natural gas, it will be a positive for prices. For now, they seem to be locked in a downtrend.
Disclosure None
Caterpillar touts sales growth CAT
The No. 1 maker of earth-moving equipment said retail sales of machinery jumped 49% in Jan., led by a 58% surge in N. America and a 56% increase in Latin America, as those regions started catching up to the recovery that began earlier in Asia. Caterpillar's (CAT) global engine sales rose 23% in Jan. Bucyrus, which is being bought by Cat, said Q4 EPS leapt 48% as sales nearly doubled, helped by an acquisition. Cat climbed 2.4% to 105.86.
Caterpillar Inc. manufactures and sells construction and mining equipment, diesel and natural gas engines, and industrial gas turbines worldwide. Its Machinery business engages in the design, manufacture, marketing, and sale of construction, mining, and forestry machinery, such as track and wheel tractors, track and wheel loaders, pipelayers, motor graders, wheel tractor-scrapers, track and wheel excavators, backhoe loaders, log skidders, log loaders, off-highway trucks, articulated trucks, paving products, skid steer loaders, underground mining equipment, tunnel boring equipment, and related parts.
This business also involves in the design, manufacture, remanufacture, maintenance, and service of rail-related products, as well as offers logistics services. The company's Engines business designs, manufactures, markets, and sells engines for electric power generation systems, locomotives, marine, petroleum, construction, industrial, agricultural, and other applications; and related parts. This business also provides remanufacturing services for other companies. Its Financial Products business provides various financing alternatives to customers and dealers for the company's machinery and engines, solar gas turbines, and other equipment and marine vessels, as well as offers loans to customers and dealers.
This business also provides various forms of insurance to customers and dealers to support the purchase and lease of its equipment. Caterpillar markets its products through distribution centers. The company was formerly known as Caterpillar Tractor Co. and changed its name to Caterpillar Inc. in 1986. Caterpillar was founded in 1925 and is headquartered in Peoria, Illinois.
Disclosure I am Long CAT shares.
True To Form, Coke Raises Dividend 7% Streak Continues Since 1920 has paid Dividends
Coca-Cola (KO) has history that dates back to 1886. It also has a long record of returning cash to shareholders. It has paid dividends each year since 1920, about a year after it began listing on the New York Stock Exchange.
On Thursday, Coca-Cola's board approved lifting its quarterly shareholder payout by 7% to 47 cents a share. The beverage giant cited confidence in its long-term cash flow. This dividend is payable April 1 to shareholders of record as of March 15.
From an annual standpoint, Coca-Cola pays $1.88 a share for a current yield of about 3%. That's the biggest yield among the dividend paying stocks in IBD's Beverages-Non Alcoholic group. The company has raised its dividend for 49 consecutive years.
Coca-Cola is a member of the S&P 500 Dividend Aristocrats index, which is made up of blue-chip companies that have paid increasing dividends each year for at least 25 years. Coca-Cola is also one of billionaire investor Warren Buffett's biggest holdings in his Berkshire Hathaway (BRKA). As of Dec. 31, Berkshire Hathaway owned 200 million shares.
Meanwhile, Dr Pepper Snapple Group (DPS) popped Thursday after posting better-than-expected quarterly results. Thanks to increased demand for Dr Pepper, 7-Up and Sunkist beverages, the company reported Q4 earnings of 67 cents a share, up 52% and 3 cents above views. Sales grew 4% to $1.41 billion, also above views. Both top- and bottom-line growth was the best in years.
Looking ahead, Dr Pepper Snapple expects full-year 2011 profit of $2.70 to $2.80 a share. Analysts polled by Thomson Reuters expected $2.72 a share.
Dr Pepper Snapple Group came about in 2008 after it was spun off from Cadbury Schweppes Americas Beverages.
The company declared its first-ever quarterly dividend, of 15 cents a share, in November 2009. It most recently raised the payout by 67% to 25 cents a share in May.
Earlier this month, the company declared a quarterly dividend of a quarter a share. The annual $1-per- share rate works out to a yield of about 3%.
Disclosure NONE
Closed-End Funds Can Open Profit Potential, funds for income, diversification
Most investors are familiar with mutual funds and exchange-traded funds (ETFs), but fewer are familiar with closed-end funds.
Despite being older than both mutual funds and ETFs, closed-end funds (CEFs) offer some distinct advantages for long-term investors who want to diversify their holdings.
Despite their name, CEFs are always open to new investors, even after the fund has started to trade. “Closed-end funds” derived that name because they offer a finite number of shares, so the amount of shares is limited or closed. As a result, a CEF does not continuously offer new shares. When a new investor wants to buy into the CEF, they will see a continuous bid and offer throughout the trading day based on the current market price of the CEF’s holdings. Since the CEF has a limited number of shares, its price is based on market demand.
In contrast, the price of a mutual fund is based on the net asset value (NAV) of its holding as determined at the end of the trading day. Another major difference between mutual funds and closed-end funds is that mutual funds can continuously offer new shares to new investors. In theory, a mutual fund can continuously grow to accommodate new investors. CEFs can not since they only offer a finite number of shares.
Aside from how their share price is determined, CEFs and mutual funds have many similar features: CEFs can invest in bonds, real estate, growth, small cap, value and international stocks. They also can use leverage, so some closed-end funds invest in real estate and other assets which require the use of borrowed money. Investors also buy into the CEF at par, so subsequent prices can go lower or higher.
Closed-end funds differ from exchange-traded funds because they provide active management, as opposed to the indexes that underlie ETFs.
One of the Oldest Fund Investments
There are about 750 CEFs offered, according to Brian M. Smith, director of the Closed-End Fund Association in Kansas City, Mo. Some of the oldest CEFs – General American Investors (NYSE: GAM), Adams Express Company (NYSE: ADX), Tri Continental (NYSE: TY) — started in 1929, Smith said. That was well before the introduction of mutual funds, which trace their origins to the Investment Company Act of 1940. CEFs also are more heavily regulated than mutual funds, Smith said, since they are registered both as corporations and mutual funds. Today, many of the same large companies that offer mutual funds — Royce Funds, Gabelli Funds, Nuveen , BlackRock — also use their investment expertise to offer CEFs.
Risks and Rewards of Closed-End Funds
CEFs are usually appropriate for people seeking income, and for investors “looking for the opportunity of greater return, who can also assume greater risk,” Smith said.
Since CEFs can invest in leveraged investments, such as non-liquid assets like a shopping center, and trade at a market value, they often trade at a discount, Smith explained. When this occurs, the average closed-end fund can be sold for less than the value of the assets it already owns. As the CEFs discount narrows, it creates greater returns for its investors.
Investors who purchase CEFs pay commissions which are no different than those in the mutual fund industry, Smith said. They can be bought at a discount from a broker-dealer, discount broker, financial adviser or as part of an auto-direct investment program,
Since CEFs can invest in leveraged assets, they are typically not offered in 401(k) plans, Smith said.
Disclosure I am long 18 closed end funds none of which are mentioned here.
My favorite Closed end fund research site is CEF CONNECT.
What Happens When You Over Contribute into IRAs?
You always hear that you need to “Save, Save, Save” for retirement, but is it really possible to save too much? When it comes to contributing to your IRA, it can.
Individual Retirement Accounts (IRAs) have annual contribution limitations that indicate how much you’re allowed to contribute. Anyone, regardless of income level can contribute to Traditional IRAs, but in addition to having a maximum contribution amount for a Roth IRA, you’ll also need to have annual income within limitations in order to contribute, at all.
It’s always best to prevent over contributions into IRAs, whether you have a Roth IRA or a Traditional IRA, so consult a tax professional if you have any questions about your allowed contribution amounts each year. If you do contribute more than you are supposed to, also consult a tax professional for advice on how to remove the overage to avoid penalties and tax implications.
Like a Roth IRA, you can contribute up to $5,000 per year, although if you earn less than $5,000 in a year you’re allowed to contibute 100% of your earned income (whichever is less). If you’re over the age of 50, you can make catch-up contributions of $1,000 for years 2009 and 2010.
Another time I see this occur is when someone has automatic contributions being directly deposited into their IRA. Either they forget the amount or just lose track of how much they’ve contributed (you should be always be able to check with your IRA custodian to see how much you’ve contributed). In the event that this occurs, you can always apply the excess contributions to a future tax year so as long as the amount does not exceed the contribution limit for next year, too. Keep in mind though that the 6% excess tax may still apply.
Disclosure I have a IRA at sharebuilder.com
Individual Retirement Accounts (IRAs) have annual contribution limitations that indicate how much you’re allowed to contribute. Anyone, regardless of income level can contribute to Traditional IRAs, but in addition to having a maximum contribution amount for a Roth IRA, you’ll also need to have annual income within limitations in order to contribute, at all.
It’s always best to prevent over contributions into IRAs, whether you have a Roth IRA or a Traditional IRA, so consult a tax professional if you have any questions about your allowed contribution amounts each year. If you do contribute more than you are supposed to, also consult a tax professional for advice on how to remove the overage to avoid penalties and tax implications.
Roth IRAs
For Roth IRAs, you can contribute $5,000 per year if you’re under the age of 50 and as much as $6,000 annually if you’re over the age of 50. The contribution limitation is adjusted based on your annual adjusted gross income, however. If you make between $105,000 and $120,000 a year as a single tax filer, you can make partial contributions based on the amount you earn. If you are married and make more than $166,000 but less than $176,000 you can also make partial contributions. If you make more than the stated annual income amounts, you’re not allowed to contribute to an IRA at all.What if You Contribute Too Much in a Roth IRA?
If you contribute more than you are allowed into a Roth IRA, you can withdraw the amount over the limit by the date you file your income tax return. If you fail to withdraw the amount you’ve over contributed, you will have to pay 6% excise tax on the overage amount (and any earnings it has made).Traditional IRA
Contributes to Traditional IRAs are tax deductible, and directly reduce the amount of taxable income you have in the year that you make your contributions.Like a Roth IRA, you can contribute up to $5,000 per year, although if you earn less than $5,000 in a year you’re allowed to contibute 100% of your earned income (whichever is less). If you’re over the age of 50, you can make catch-up contributions of $1,000 for years 2009 and 2010.
What if You Contribute Too Much in a Traditional IRA?
If you contribute more than you are allowed into a Traditional IRA, you can withdraw the excess contribution before you file your income taxes without penalty. If you don’t realize the over contribution until after you’ve filed your taxes, however, you will withdraw the excess amount and be penalized 6% for each year the money remained in your account when it should not have been there. You’ll need to file IRS Form 5329 when you withdraw your funds and it can be treated as an “early withdrawal”. Under Traditional IRA early withdrawal rules, you could be taxed twice on the withdrawal.How Does this Happen?
The most common time I see someone over contribute to an IRA (Roth or Tradtional) is when they have IRA’s at two different locations; for example, a bank at a brokerage firm. You have to understand that just because you have multiple IRA’s at different financial institutions doesn’t mean you can contribute $5,000 to each. That same rule applies to having both Traditional and Roth IRA’s.Another time I see this occur is when someone has automatic contributions being directly deposited into their IRA. Either they forget the amount or just lose track of how much they’ve contributed (you should be always be able to check with your IRA custodian to see how much you’ve contributed). In the event that this occurs, you can always apply the excess contributions to a future tax year so as long as the amount does not exceed the contribution limit for next year, too. Keep in mind though that the 6% excess tax may still apply.
Keep Track of How Much You Put Into Your IRA
It goes without saying that the easiest way to prevent putting too much into your Roth and Traditional IRA’s is to keep track of how much you’ve added. As I’ve mentioned before, even if you lose track, your IRA custodian should have a record of how much you’ve contributed for the current tax year.Disclosure I have a IRA at sharebuilder.com
Five High Yield Dividend Growth Stocks Raising Distributions
Dividend investors typically face a tradeoff between dividend yield and dividend growth. Companies with high yields often keep distributions unchanged or do not increase them at a rate that would compensate for the eroding power of inflation. Because of the higher yields, retirees tend to prefer the higher yield today. The companies with low yields on the other hand typically can afford to grow distributions much faster than the rate of inflation. Younger investors typically invest in these dividend growth stocks, in order to generate a sufficient yield on cost down the road.
The dividend growth companies that raised distributions last week were no exception:
Enterprise Products Partners L.P. (EPD) provides a range of services to producers and consumers of natural gas, natural gas liquids (NGLs), crude oil, refined products, and petrochemicals in the continental United States, Canada, and Gulf of Mexico. This master limited partnership announced a 1.30% increase in its quarterly distributions to 59 cents/unit. This was also a 5.40% increase over the Q1 2010 distribution. This dividend achiever has raised distributions every year since going public in 1998. Yield: 5.50
Plains All American Pipeline, L.P. (PAA), through its subsidiaries, engages in the transportation, storage, terminalling, and marketing of crude oil, refined products, and liquefied petroleum gas and other natural gas-related petroleum products (LPG) in the United States and Canada. This master limited partnership announced a 0.80% increase in its quarterly distributions to 95.75 cents/unit. This was also a 3.20% increase over the Q1 2010 distribution. This dividend achiever has raised distributions every year since going public in 1999. Yield: 5.90%
Genesis Energy, L.P. (GEL), together with its subsidiaries, operates in the midstream segment of the oil and gas industry in the Gulf Coast area of the United States. The company operates through four divisions: Pipeline Transportation, Refinery Services, Industrial Gases, and Supply and Logistics. This master limited partnership announced a 3.20% increase in its quarterly distributions to 40 cents/unit. This was also a 11.10% increase over the Q1 2010 distribution. In addition to that Genesis Energy announced the elimination of its incentive distribution rights to the general partner. This MLP has raised distributions for seven years in a row. Yield: 5.90%
Shaw Communications Inc. (SJR), a diversified communications company, provides broadband cable television, Internet, digital phone, telecommunications, and satellite direct-to-home (DTH) services primarily in Canada and the United States. The company increased monthly dividends by 5% to 7.67 canadian cents/share. Shaw Communications is a member of the international dividend achievers index, and has increased dividends for 9 years in a row. Yield: 4.40%
Alliant Energy Corporation (LNT) operates in electric and gas utility businesses in the United States. The company announced a 13% raise in its quarterly dividends to 42.50 cents/share. This was the ninth consecutive dividend increase for Alliant Energy. Yield: 4.50%
CVS Caremark Corporation (CVS) operates as a pharmacy services company in the United States. It operates in two segments, Pharmacy Services and Retail Pharmacy. The company announced a 43% raise in its quarterly dividends to 12.50 cents/share. This was the eight consecutive dividend increase for CVS Caremark. Yield: 1.40%
Most of the companies which raised distributions last week, and have raised distributions for over 5 years, were high dividend stocks such as master limited partnerships, utilities and telecoms. While their current yields are high, their dividend growth rates have been low. CVS on the other hand has a low current yield, however the dividend has been rising quickly. Just like anything in life, a balanced approach to include high yield stocks with low dividend growth, low yield stocks with high dividend growth and stocks with moderate yields and growth would ensure that investors receive a diversified income stream which provides sufficient current dividend income today, while also providing a decent dividend growth over time.
Full Disclosure: None
Clorox: Why This Dividend Aristocrat Deserves More Respect
Popular brand names at Clorox (CLX) include: Clorox bleach, Green Works, Armor All, STP, Scoop Away cat litters, Kingsford, Hidden Valley, K C Masterpiece dressings and sauces, Brita, Glad bags and Burt’s Bees natural personal care products. 70% of the brands hold a #1 market share and another 18% hold a #2 market share position in their categories.
Fiscal 2010 segment results ($ figures in billions) were:
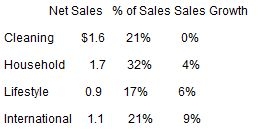
Dividends have been increased annually since 1977, easily qualifying CLX as an S&P 500 Dividend Aristocrat. Last May, the quarterly dividend was increased to 55¢ ($2.20 annualized).
Recent dividend history:
The markets were disappointed with fiscal Q1 results reported in November 2010, causing the low beta stock to drop $4 in 3 days. CLX said:
Leading household brands at CLX are growing at modest rates in the US and rapidly overseas. In the last 6 years, international sales have been growing 2-3 times the rate of domestic sales. 58% of international sales come from Latin America and only 5% are in Asia (offering large growth potential). International business is expected to account for a substantial portion of future growth
Company EPS guidance for FY2011 remains $4.05-$4.20. Fiscal Q2 results and any guidance updates will be released in the first week of February. Analysts are forecasting EPS of $4.00 in FY2011 and $4.48 for next year. Company finances remain strong, especially after selling the AutoCare businesses which will provide funds to repurchase over 12 million shares of treasury stock in FY2011.
In the last 6 years the stock has largely traded in the $55-65 range while dividends have been growing. At $65, with a P/E of 13X and a yield of 3.4% (the dividend will be raised in May), long term investors who can tolerate current conditions should find CLX an attractive investment.
Disclosure I am long CLX shares.
Fiscal 2010 segment results ($ figures in billions) were:
Dividends have been increased annually since 1977, easily qualifying CLX as an S&P 500 Dividend Aristocrat. Last May, the quarterly dividend was increased to 55¢ ($2.20 annualized).
Recent dividend history:
The markets were disappointed with fiscal Q1 results reported in November 2010, causing the low beta stock to drop $4 in 3 days. CLX said:
We faced a challenging economic environment, as evidenced by category softness in the U.S. along with the impact of the Venezuela currency devaluation," said Chairman Don Knauss. "Late first-quarter shipments were particularly soft and that trend has continued into the first weeks of our second quarter. While we're disappointed not to have delivered stronger first-quarter results, we manage our business for the long term. I believe we're taking the right actions to maintain the long-term health of our brands and help strengthen our categories as the economy recovers.Company guidance given for FY2011 was:
- 0-2% sales growth
- 25-50 basis points gross margin growth (unchanged)
- Diluted EPS from continuing operations in the range of $4.05-$4.20
While second quarter sales results are likely to be a little lower than previously anticipated, as reflected in our updated full year sales outlook, we believe our categories are stabilizing, giving us momentum into the second half of the year, and we should benefit from our recent market share gains. We have a solid new-product pipeline, enabling further growth across a number of categories, and we anticipate improved performance in the second half of the year, including topline growth in the range of 2 percent to 4 percent. Further, the impact of the prior-year Venezuela devaluation and unusually strong year-ago H1N1-related sales will be behind us.Q2 will have a goodwill impairment charge of $250-255 million ($1.78-1.82 diluted EPS) related to Burt's Bees business (with no tax benefit expected). In November 2010, CLX completed the sale of Auto Care businesses with an anticipated after-tax gain of $171 million. Including the $60 million deferred tax benefit in fiscal Q1, the gain on the sale is expected to be $231 million (reflected in discontinued operations).
Leading household brands at CLX are growing at modest rates in the US and rapidly overseas. In the last 6 years, international sales have been growing 2-3 times the rate of domestic sales. 58% of international sales come from Latin America and only 5% are in Asia (offering large growth potential). International business is expected to account for a substantial portion of future growth
Company EPS guidance for FY2011 remains $4.05-$4.20. Fiscal Q2 results and any guidance updates will be released in the first week of February. Analysts are forecasting EPS of $4.00 in FY2011 and $4.48 for next year. Company finances remain strong, especially after selling the AutoCare businesses which will provide funds to repurchase over 12 million shares of treasury stock in FY2011.
In the last 6 years the stock has largely traded in the $55-65 range while dividends have been growing. At $65, with a P/E of 13X and a yield of 3.4% (the dividend will be raised in May), long term investors who can tolerate current conditions should find CLX an attractive investment.
Disclosure I am long CLX shares.
Diana Shipping Shines Despite Shipping's Foggy Future
Diana Shipping (DSXdsx quote is in the business of dry bulk shipping. Diana ships dry bulk goods such as wheat, iron ore, coal, and other commodities. In the recent past, the dry bulk shipping industry has been beaten down. While the future of the dry bulk industry is hard to predict, Diana is positioned to do very well in the event that dry bulk shipping picks up again and I believe it can withstand a sluggish future in shipping.
Industry overview
The dry bulk shipping industry is driven by a variety of factors. The main factors (in order of importance) are:
1. Commodity Demand
2. Fleet Supply
3. Fuel prices
4. Weather
The volatility of these factors makes the dry bulk shipping a cyclical industry. The factors listed above led to a boom in 2007/2008. China's seemingly insatiable demand for dry bulk goods, particularly iron ore was the main driving factor. From late 2006 to late 2007, Diana's stock price returned 300%. However, as it turns out, China's demand was eventually satisfied and the industry went bust late in 2008. Subsequently, Diana's stock price fell about 60%.
The last couple years have been sluggish for shipping. What's worse is that shipping isn't out of the woods yet. There are more worries for the future of dry bulk shipping. This article from Morningstar gives a good overview of the industry. One would think that an industry whose forecast is fraught with fears would be an unattractive investment. I would argue otherwise. To quote Buffett, "Be fearful when others are greedy, greedy when others are fearful". The fear surrounding the shipping industry presents a great opportunity for investment.
As mentioned above, commodity prices have a large impact on the shipping industry. Below is a graph plotting the BDI (A measure of shipping prices) against the CRB index (a measure of commodity prices):
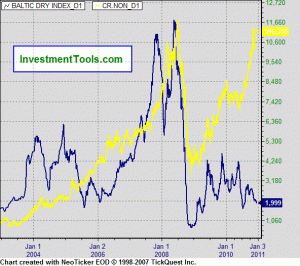 From 2002-2009 there was a modest relationship between commodity prices and shipping rates. The rationale behind the relationship is as follows: As demand for commodities increases, the price increases. The buyers and sellers of the commodities need to transport the commodities to each other, thus demand for shipping increases subsequently raising shipping rates.
Starting in 2010, the relationship ceased to exist. Commodities and shipping started moving in opposite directions. A couple of reasons that prices may be staying low is because of an increasing supply of vessels, and the increasing price of crude oil. However, the high oil prices in 2007/08 didn't seem to slow down shipping rates. That being said, the only factor contributing to low shipping rates is the oversupply of vessels. I think this factor is overplayed. While vessel supply is expected to grow in the 10-12% range from 2009-2011, vessel scrapping is also on the rise. This will partially offset the increased supply in vessels. All things considered, I believe today's shipping prices are artificially low. Increasing commodity demand should increase shipping, leading to an increase in shipping rates.
Company overview
When people think bulk dry shipping, they think of shipping iron ore and coal. This is a major part of the industry, but does not contribute as much to Diana's bottom line as it does to its competitors. Based on Diana's fleet composition and major customers, it would appear that Diana is mainly focused on the supply of grain and wheat. Diana's fleet is comprised primarily of medium sized vessels. Medium and small sized vessels are used for shipping mainly iron ore, coal, and grains. A benefit of smaller ships is that they are the more economically efficient for transporting grains. The downside of medium-sized vessels (as compared to larger vessels) is that they don't benefit from the same economies of scale from transporting iron ore. Over the past few years, Diana's largest customers have been Cargill, BHP (BHP), The Australian Wheat board, and China National. These customers have represented approximately 35-50% of revenues. Based on these customers, it would appear that a sizable portion of Diana's revenue is derived from wheat.
In terms of commodities, Diana is more diversified than other shippers. This lowers the reliance on any one commodity and lowers the overall business risk. Based on the major competitors, it appears that a lot of Diana's business is coming from the Australian-China trade route. This could have a positive short-term impact on Diana, as Australia had an above average wheat harvest this year.
Diana shipping has been investing heavily in purchasing a new ships. Capital expenditures were ramped up in 2007/2008. Today, Diana has the youngest fleet in the industry. This is beneficial because newer ships benefit from improved fuel efficiency. In the face of rising oil prices, Diana will have a competitive advantage over its peers.
Revenue has seen inconsistent high growth. Diana's revenue has a 5-year average growth rate of 30.25%, including a large decrease in 2009. Operating income growth is a bit lower, but a similar story. Net income has been a bit more volatile. It showed slow growth prior to 2007, a large increase in 07/08, and has been back to '07 levels for the past two years. Inconsistent income is a bad sign, but a necessity of a highly cyclical industry.
Diana's financials are in good shape. Diana has a strong balance sheet, which is a must-have in a highly cyclical industry. The company's iquidity is the highest in the industry, and debt is the lowest. Because of a low level of leverage, Diana will benefit less in the boom cycle, but will fare better in a bust cycle. Considering a great deal of uncertainty in the future of dry bulk shipping, I think Diana Shipping is a safe bet.
Diana Shipping benefits from a strong management team. Management has been making decisions that are favorable for shareholders. The 5-year average ROA, ROE, and ROI metrics are 16.8%, 17.16%, and 20.86%, respectively. These are all well above the industry average, and very respectable numbers for any industry. Share purchases and buybacks are also in line with shareholders' interests. In 2007 Diana's stock price was trading in the $16.50-$42.50 range. During this time, management was aggressively selling its shares and using these proceeds to buy ships. It also paid nearly all of its net income through dividend payments. Management was rationally cashing in when the times were good, as if preparing for a slowdown. Well, that slowdown happened. After the booming shipping industry went bust in late 2008, Diana stopped selling stock, and stopped paying dividends.
In May 2010, management initiated a share buyback program for $100M, or 10% of its market capitalization. It would appear that management felt DSX stock price was undervalued in the $13-14 range. Today they are trading at $12.02. It is great to see a management team that has a track record of good decisions for shareholders. It is also a great to see management signaling to the market that DSX is undervalued by buying back shares. It would seem we both agree that DSX is undervalued.
Valuation
Diana is trading below its fair value. At a price of $12.02, it is trading at 7.92 P/E and 6.10 EV/EBITDA. These are average for the industry, and low by historical standards. During the boom of 2008, DSX was trading at double today's valuation multiples.
I ran a discounted cash flow analysis on DSX. Please click on the image below to view my assumptions/calculations;
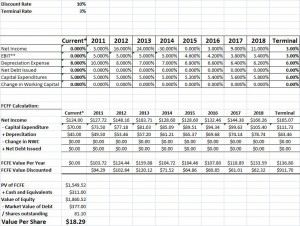
My profit assumptions are in line with the cyclical nature of the business, aka: volatile swings in net income. Capital expenditure and depreciation assumption are based on the implications of recent capital expenditure. I obtain an intrinsic price of $18.29. The current market price is $12.02, offering a margin of safety equal to 34.28%.
Conclusion
The future of the dry bulk shipping industry is uncertain. What is certain, is that shipping is a cyclical industry, and has been suffering tremendously in the past couple years. Macroeconomic trends suggest that a recent surge in commodity prices should have increased shipping rates. This has not happened, and the dry bulk shipping industry stands to increase from catch-up in shipping rates to commodity prices. Diana Shipping has a diverse commodity shipping profile, with higher than average focus on grains.
In terms of financials, Diana Shipping has low leverage, and high profitability. Management has shown good performance through capital allocation decisions, impressive return on capital, and recent share buybacks. The stock price took a massive 60% tumble in late 2008 and while the rest of the market has recovered, it has stayed depressed. Today, Diana is an industry leader that is valued similarly amongst its competitors. By historical standards, it's trading at half of its valuation from its early 2008 highs. A discounted free cash flow analysis shows DSX exhibited a large margin of safety. An investment in Diana Shipping at $12.02 presents an opportunity of above industry average returns if dry bulk shipping remains grim, and great returns in the event of a turnaround in shipping.
Disclosure: I do not OWN DSX.
Industry overview
The dry bulk shipping industry is driven by a variety of factors. The main factors (in order of importance) are:
1. Commodity Demand
2. Fleet Supply
3. Fuel prices
4. Weather
The volatility of these factors makes the dry bulk shipping a cyclical industry. The factors listed above led to a boom in 2007/2008. China's seemingly insatiable demand for dry bulk goods, particularly iron ore was the main driving factor. From late 2006 to late 2007, Diana's stock price returned 300%. However, as it turns out, China's demand was eventually satisfied and the industry went bust late in 2008. Subsequently, Diana's stock price fell about 60%.
The last couple years have been sluggish for shipping. What's worse is that shipping isn't out of the woods yet. There are more worries for the future of dry bulk shipping. This article from Morningstar gives a good overview of the industry. One would think that an industry whose forecast is fraught with fears would be an unattractive investment. I would argue otherwise. To quote Buffett, "Be fearful when others are greedy, greedy when others are fearful". The fear surrounding the shipping industry presents a great opportunity for investment.
As mentioned above, commodity prices have a large impact on the shipping industry. Below is a graph plotting the BDI (A measure of shipping prices) against the CRB index (a measure of commodity prices):
[click to enlarge]

Starting in 2010, the relationship ceased to exist. Commodities and shipping started moving in opposite directions. A couple of reasons that prices may be staying low is because of an increasing supply of vessels, and the increasing price of crude oil. However, the high oil prices in 2007/08 didn't seem to slow down shipping rates. That being said, the only factor contributing to low shipping rates is the oversupply of vessels. I think this factor is overplayed. While vessel supply is expected to grow in the 10-12% range from 2009-2011, vessel scrapping is also on the rise. This will partially offset the increased supply in vessels. All things considered, I believe today's shipping prices are artificially low. Increasing commodity demand should increase shipping, leading to an increase in shipping rates.
Company overview
When people think bulk dry shipping, they think of shipping iron ore and coal. This is a major part of the industry, but does not contribute as much to Diana's bottom line as it does to its competitors. Based on Diana's fleet composition and major customers, it would appear that Diana is mainly focused on the supply of grain and wheat. Diana's fleet is comprised primarily of medium sized vessels. Medium and small sized vessels are used for shipping mainly iron ore, coal, and grains. A benefit of smaller ships is that they are the more economically efficient for transporting grains. The downside of medium-sized vessels (as compared to larger vessels) is that they don't benefit from the same economies of scale from transporting iron ore. Over the past few years, Diana's largest customers have been Cargill, BHP (BHP), The Australian Wheat board, and China National. These customers have represented approximately 35-50% of revenues. Based on these customers, it would appear that a sizable portion of Diana's revenue is derived from wheat.
In terms of commodities, Diana is more diversified than other shippers. This lowers the reliance on any one commodity and lowers the overall business risk. Based on the major competitors, it appears that a lot of Diana's business is coming from the Australian-China trade route. This could have a positive short-term impact on Diana, as Australia had an above average wheat harvest this year.
Diana shipping has been investing heavily in purchasing a new ships. Capital expenditures were ramped up in 2007/2008. Today, Diana has the youngest fleet in the industry. This is beneficial because newer ships benefit from improved fuel efficiency. In the face of rising oil prices, Diana will have a competitive advantage over its peers.
Revenue has seen inconsistent high growth. Diana's revenue has a 5-year average growth rate of 30.25%, including a large decrease in 2009. Operating income growth is a bit lower, but a similar story. Net income has been a bit more volatile. It showed slow growth prior to 2007, a large increase in 07/08, and has been back to '07 levels for the past two years. Inconsistent income is a bad sign, but a necessity of a highly cyclical industry.
Diana's financials are in good shape. Diana has a strong balance sheet, which is a must-have in a highly cyclical industry. The company's iquidity is the highest in the industry, and debt is the lowest. Because of a low level of leverage, Diana will benefit less in the boom cycle, but will fare better in a bust cycle. Considering a great deal of uncertainty in the future of dry bulk shipping, I think Diana Shipping is a safe bet.
Diana Shipping benefits from a strong management team. Management has been making decisions that are favorable for shareholders. The 5-year average ROA, ROE, and ROI metrics are 16.8%, 17.16%, and 20.86%, respectively. These are all well above the industry average, and very respectable numbers for any industry. Share purchases and buybacks are also in line with shareholders' interests. In 2007 Diana's stock price was trading in the $16.50-$42.50 range. During this time, management was aggressively selling its shares and using these proceeds to buy ships. It also paid nearly all of its net income through dividend payments. Management was rationally cashing in when the times were good, as if preparing for a slowdown. Well, that slowdown happened. After the booming shipping industry went bust in late 2008, Diana stopped selling stock, and stopped paying dividends.
In May 2010, management initiated a share buyback program for $100M, or 10% of its market capitalization. It would appear that management felt DSX stock price was undervalued in the $13-14 range. Today they are trading at $12.02. It is great to see a management team that has a track record of good decisions for shareholders. It is also a great to see management signaling to the market that DSX is undervalued by buying back shares. It would seem we both agree that DSX is undervalued.
Valuation
Diana is trading below its fair value. At a price of $12.02, it is trading at 7.92 P/E and 6.10 EV/EBITDA. These are average for the industry, and low by historical standards. During the boom of 2008, DSX was trading at double today's valuation multiples.
I ran a discounted cash flow analysis on DSX. Please click on the image below to view my assumptions/calculations;
[click to enlarge]
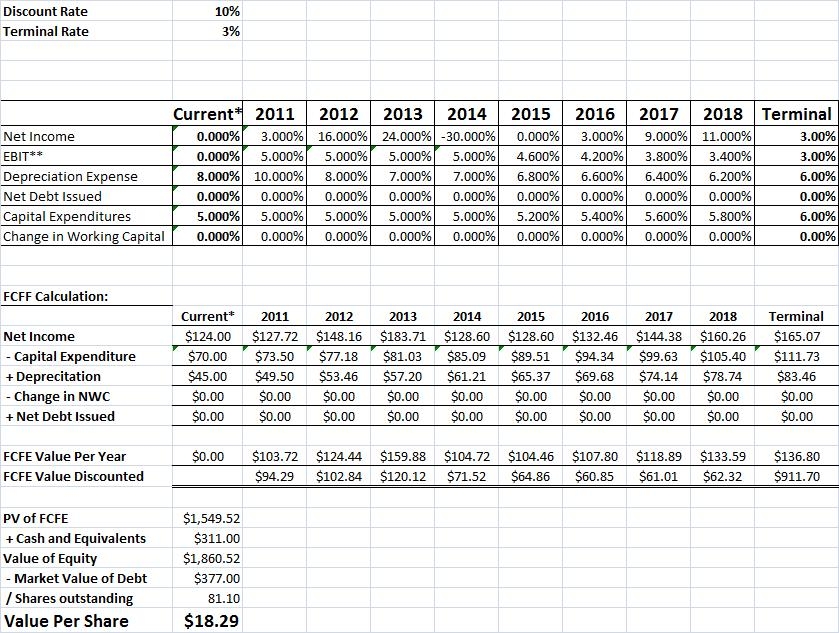
My profit assumptions are in line with the cyclical nature of the business, aka: volatile swings in net income. Capital expenditure and depreciation assumption are based on the implications of recent capital expenditure. I obtain an intrinsic price of $18.29. The current market price is $12.02, offering a margin of safety equal to 34.28%.
Conclusion
The future of the dry bulk shipping industry is uncertain. What is certain, is that shipping is a cyclical industry, and has been suffering tremendously in the past couple years. Macroeconomic trends suggest that a recent surge in commodity prices should have increased shipping rates. This has not happened, and the dry bulk shipping industry stands to increase from catch-up in shipping rates to commodity prices. Diana Shipping has a diverse commodity shipping profile, with higher than average focus on grains.
In terms of financials, Diana Shipping has low leverage, and high profitability. Management has shown good performance through capital allocation decisions, impressive return on capital, and recent share buybacks. The stock price took a massive 60% tumble in late 2008 and while the rest of the market has recovered, it has stayed depressed. Today, Diana is an industry leader that is valued similarly amongst its competitors. By historical standards, it's trading at half of its valuation from its early 2008 highs. A discounted free cash flow analysis shows DSX exhibited a large margin of safety. An investment in Diana Shipping at $12.02 presents an opportunity of above industry average returns if dry bulk shipping remains grim, and great returns in the event of a turnaround in shipping.
Disclosure: I do not OWN DSX.
DHT Maritime: A Value Play on Rising Rates
DHT Maritime (DHT) operates in the highly competitive crude oil shipping market. Their fleet consists of 3 very large crude carriers (VLCCs), 2 suezmax tankers, and 4 aframax tankers. In addition, the company recently bought a fourth VLCC (built in 1999) for $55mm.
I first became attracted to the company through this activist filing. Normally, I try to stay away from industries like this one; there is no competitive advantage or moat possible, rates are notoriously volatile, leverage ratios are high, etc. However, the filing laid out a great case for the stock to appreciate, noting it was materially undervalued compared to its peers. What really attracted to me to this, though, were the contracts they had signed for all of their ships, which had been locked into at or near the top of the market. These call for a mimimum base charter, and allow for DHT to capture around 1/3 of the prices above this base charter rate. With charter rates currently depressed, these contracts have proved to be a godsend for DHT, as they have enabled them to collect much more than they would if their ships were on the spot market.
What created the opportunity in this stock was historic mismanagement during the economic downturn. The company paid out all of their free cash flow (FCF) as a dividend until the beginning of 2008, when they set their dividend to a fixed rate of 25 cents per share. They continued to pay this dividend even as the stock market and economy cratered throughout 2008. They could do this because of the stability of cash flow from their chartered contracts. Then, in March 2009, the company raised equity for, in my mind, no good reason (the stated reason was to pay down debt, but the company wasn’t in violation of their covenants). The price they raised equity at implied a dividend yield of almost 25%, so why they raised equity instead of cutting the dividend and using those funds to pay debt I’ll never understand. Anyway, the new equity made the dividend unsustainable, and the company eventually had to cut their dividend due, in large part, to all of the new equity they raised (aren’t CEOs great?).
Flash forward to today. The company now has installed a new and seemingly talented management team. The company still has over a year left on all of their charter contracts (the first of the contracts don’t expire until April 2012, and could be renewed until as late as 2019). These contracts GUARANTEE the company will earn at least $40mm in FCF per year, which easily covers their new dividend payments of ~20mm annually.
The company trades for an EV of ~450mm and market cap of ~225mm. So an investor today gets a company with huge leverage and stable cash flows PLUS a call option on potentially rising tanker rates in the form of the profit sharing from the contracts and the newly purchased VLCC (which will go on the spot market).
The company also is kind enough to announce the appraised value of their fleet on their conference calls. With the recent purchase of the VLCC, the appraised value of the ships is just over $415mm. With EV at ~$440m, the investor is paying a premium of ~25m (around 5% of the value of their ships) as a premium for the cash flow guarantees and an option on rising tanker rates and prices.
So I think DHT is slightly undervalued at today’s prices. I can think of three types of people who would benefit from taking a harder look at DHT.
First, investors looking for a high dividend yield - DHT yields in excess of 8%, and the payout is well covered by the cash flows from the contracts. Second, investors who are looking for a way to pay a potential rise in tanker prices. DHT won’t benefit as much as its competitors who have their entire fleet completely on the spot market in such an environment, but they will benefit, and an investor doesn’t have to worry as much about the downside its competitors have in case rates collapse. Rising oil = Rising rates = rising tanker prices. The stressed capital markets + low rates have resulted in extremely depressed tanker prices, and as the global economy continues to recover tanker prices should continue to rise.
However, the main reason I wrote about this stock is for value investors. In the event that the market pulls back and takes DHT along with it, it could create an excellent value buying opportunity to pick the company up for below the value of their ships and earn the the contractually guaranteed cash flows for free.
Disclosure: I do not OWN DHT shares.
Subscribe to:
Posts (Atom)