Your Ad Here

Friday, February 18, 2011

6 Noteworthy Stocks with Yields Over 4%

If you’re looking to boost the total dividend yield of your portfolio, picking up a few stocks yielding 4%, 5%, or 6% can go a long way. One must be careful, of course, to select companies that have sustainable dividend payouts and that are good long-term investments. Although not every one of these may make for a good investment, and readers should do their own more thorough research, here are six high-yielding companies that are worth being aware of.

Altria Group (MO)

Altria is one of the largest tobacco companies in the world, and also has an interest in alcoholic beverages. Depending on the individual investors views on ethical investing, it may or may not meet your requirements for inclusion in your portfolio, but the dividend yield is particularly high. There have been threats to the tobacco industry in many countries including the US for quite a while, and the uncertainty has kept stock valuations quite low. Coupled with the high dividend yields, tobacco investors that have reinvested their dividends have absolutely crushed the market over the last few decades. With a market capitalization of over $50 billion, Altria is the market leader in the United States. A key downside to this stock is Altria’s balance sheet. With a fairly high debt/equity ratio, a moderately low (but very stable) interest coverage ratio, and goodwill that approximately equals shareholder equity, Altria’s balance sheet leaves a lot to be desired. This is partially offset by the consistency of sales and profits, but worth taking into consideration when investing.
Dividend Yield: 6.30%
Latest Annual Dividend Increase: 10%
Payout Ratio: 80%
Total Debt/Equity Ratio: 2.37

CenturyLink (CTL)

CenturyLink, created after the acquisition of EMBARQ by CenturyTel, is an integrated communications company with significant operations in the heartland of the United States. The dividend yield has decreased a bit in recent months due to a significant stock rally, but the yield is still quite significant. The high payout ratio makes the dividend a little bit risky, and limits dividend growth. This is typical in this industry, however, and the consistent operations help keep the dividend stable. CenturyLink, like the previously mentioned stock, has a balance sheet that is stable but not particularly appealing.
Dividend Yield: 6.50%
Latest Annual Dividend Increase: 4%
Payout Ratio: 91%
Total Debt/Equity Ratio: 0.79

Allete (ALE)

Allete operates in both the energy and real estate industries. The company has significant leverage, but this is to be expected from a utility, and the stock trades at a lower P/B ratio than many other utilities. The utility portion of this company operates mainly in the US Midwest, and they have significant and growing renewable energy sources in the form of wind and hydro power. The company has a significant amount of real estate in Florida, and intends to sell at reasonable prices. A strike against ALE is that the company did not increase the dividend in 2010 over 2009.
Dividend Yield: 4.70%
Latest Annual Dividend Increase: 0%
Payout Ratio: 74%
Total Debt/Equity Ratio: 0.81

Leggett and Platt (LEG)

Leggett and Platt is a diversified designer and manufacturer of engineered components for a variety of industries. The balance sheet for the company is mediocre. The valuation and payout ratio are a bit high, but that is partly due to the cyclical nature of the company. As the economy recovers, continued rebound is expected by analysis forecasts. The good news for the company is that it generates extremely impressive cash flows, and in particular, a very healthy level of free cash flow in comparison to their net earnings. This allows the company to not only offer a significant dividend yield, but also to spend a considerable amount of money on share repurchases which fuel dividend growth.
Dividend Yield: 4.70%
Latest Annual Dividend Increase: 4%
Payout Ratio: 90%
Total Debt/Equity Ratio: 0.56

The Southern Company (SO)

The Southern Company is an electrical utility operating in Alabama, Florida, Georgia, and Mississippi. SO provides a recession-resistant and substantial dividend to potential investors. Downsides of the company include a weak balance sheet (but fair for a utility), and weak free cash flow. The dividend growth rate is significant considering the yield, and so the combined dividend yield and dividend growth rate is fairly attractive. I do find utilities, as a group, to be fairly expensive in the current market.
Dividend Yield: 4.80%
Latest Annual Dividend Increase: 4%
Payout Ratio: 73%
Total Debt/Equity Ratio: 1.07

Lockheed Martin (LMT)

Based on the recently increased dividend and the continually decreasing stock valuation, this large defense and aerospace company now offers a dividend yield in excess of 4%. Revenue, earnings, and cash flow have all performed strongly during the recession. Free cash flow is substantial, and enough to support the significant dividend payout. Unfortunately, like many companies on this list, Lockheed Martin has a balance sheet with a fairly large amount of debt, and goodwill that greatly exceeds shareholder equity. The interest coverage ratio, however, is higher than one might expect, and that’s a sign of stability. The low valuation, substantial dividend growth and yield (even with a low payout ratio), may make this stock reasonably attractive despite the shortcoming of the balance sheet.
Dividend Yield: 4.00%
Latest Annual Dividend Increase: 20%
Payout Ratio: 34%
Total Debt/Equity Ratio: 1.28

Full Disclosure: I am long CTL,PEG and SO.

Commodity ETFs and Contango

Commodity exchange traded funds (ETFs) have become one of the most popular fund types with investors. They don’t all work the same, however, and before you dive in, you need to understand this market in a bit of detail to avoid getting surprised, or worse, burned.

Michael Iachini for Charles Schwab reports that in order to understand how commodity ETFs work, you’ll need to know what it’s tracking and how it’s tracking it.
  • Spot Price: The spot price of a commodity is the price that it is trading at right now. If you wanted to buy a barrel of oil or a bushel of corn to take home today, you would pay the spot price.
  • Futures Price: The futures price is the price you would pay today for the right to receive the commodity at some point in the future (for example, three months from today). With a futures contract, you’re locking in a price today rather than waiting to see what the spot price will be at some point in the future and then making the purchase at that price. It’s most advantageous, of course, to see the futures price go up after you’ve locked in a lower price.
But if the futures price does go up, it means the market for that commodity is in contango. An ETF that holds futures contracts is going to have worse returns than the physical commodity if the market remains in contango, because the fund manager has to go in and buy a more expensive futures contract.

As ETF providers become more aware of these issues, however, they’re structuring their strategies around mitigating the impact of contango. Backwardation is the opposite phenomenon, Joyce Hanson for Advisor One reports.

There are two key types of commodity ETFs that give exposure to prices:
  • Physical ETFs: If your ETF holds the physical commodity, the value of your ETF shares will move with the spot price of the commodity, though the price could also be affected by security issues and the cost of storing the commodity itself. ETFS Physical Swiss Gold (NYSEArca: SGOL) is one of the growing number of such funds; each share is backed by a fractional ownership in gold bars, which are stored in secure vaults around the world.
  •  
  • Futures Contracts: Other ETFs hold baskets of futures contracts and never take possession of the physical commodity. This is the most common commodity ETF structure, whether it’s for oil, agricultural commodities, broad baskets of commodities or even some precious metal ETFs. Storing oil or wheat is more difficult than storing bullion, which is why these ETFs don’t just hold the physical goods. United States Oil (NYSEArca: USO), which owns oil futures contracts, is one example of such a fund. In fact, most commodity ETFs own futures – they’re less frequently physically-backed. 
Disclosure None

Emerging Market ETFs: VWO Takes the Lead

There’s a new leader in the battle of the emerging market exchange traded funds (ETFs).

On Jan. 18, the iShares MSCI Emerging Index Fund (NYSEArca: EEM) dropped to $46.36 billion in assets while Vanguard Emerging Markets ETF (NYSEArca: VWO), which rolled out two years fter EEM, hit $46.47 billion in assets, reports Olivier Ludwig for IndexUniverse. VWO was also the most popular U.S.-listed ETF in 2010, bringing in $19.34 billion.

Two reasons are attributed to VWO’s gain to fame. VWO has an expense ratio of 0.27%, as compared to EEM’s expense ratio of 0.69%. While both EEM and VWO are based MSCI Emerging Markets Index, which returned about 20% over the last year, VWO performed at 18%, whereas EEM returned 15.5%.

VWO uses a replication strategy that holds more securities than EEM to better mimic the underlying index. Still, EEM traders enjoy using the fund due to its turnovers. For instance, EEM had turnover of $726.66 billion last year alone, compared to $164.54 billion for VWO, which suggests that VWO attracts greater buy-and-hold investors.

Other notable broad emerging market ETFs include:
  • SPDR S&P Emerging Markets ETF (NYSEArca: GMM), which has $237.8 million in assets and a 0.59% expense ratio.
  • Schwab Emerging Markets Equity ETF (NYSEArca: SCHE), which has $312.9 million in assets and an expense ratio of 0.25%.
  • PowerShares FTSE RAFI Emerging Markets Portfolio (NYSEArca: PXH), which has $543.5 million in assets and an expense ratio of 0.85%.
Disclosure I am long VWO shares.

Five Energy MLPs to Consider for Income

A strong case can be made that master limited partnerships (MLPs) will outperform stocks over the next several years. Supposing that this is the case, I thought I would take a look at a few MLPs I believe are positioned to outperform.

MLPs have a different structure from most publicly traded companies. Instead of being structured as corporations, they are structured as limited partnerships. This has some big tax advantages, but can also create some tax filing complications. Be sure that you understand the MLP structure well before buying any units.

To be considered for inclusion in the following list, an MLP was required to be in the midstream business, have a debt/equity ratio below 200%, and have a current ratio above 1. From there I looked for a combination of low valuations, high profitability, high payout ratio adjusted distributions and distribution growth. Below are the five MLPs that I think best fit those criteria.

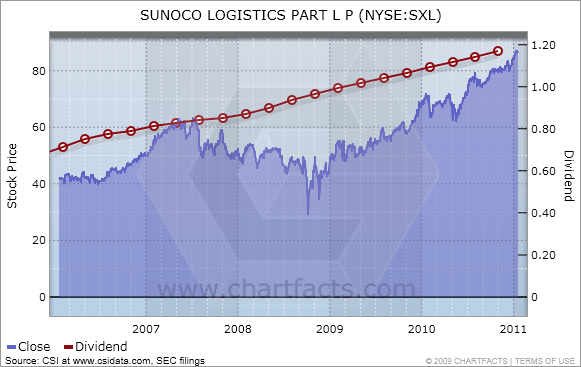
Sunoco Logistics Partners L.P. (SXL)
Sunoco Logistics transports and stores crude oil and refined petroleum products for customers in major activity centers in the Northeast, Midwest and Gulf Coast regions of the United States. The company also buys crude oil from U.S. domestic producers and sells it to refiners.
Dividend Yield: 5.47%
Payout Ratio: 48%
5 Yr Dividend Growth: 12.73%
Enterprise Value/Operating Cash Flow: 18.29
Total Debt to Equity: 140.76%
Current Ratio: 1.16
Return on Investment: 15.97%
Click to enlarge


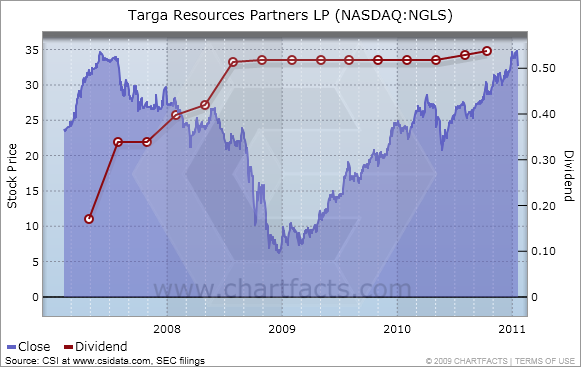
Targa Resources Partners LP (NGLS)
Targa Resources Partners is a Delaware limited partnership engaged in the business of gathering, compressing, treating, processing and selling natural gas and storing, fractionating, treating, transporting and selling natural gas liquids, or NGLs, and NGL products. The partnership owns an extensive network of integrated gathering pipelines and gas processing plants and currently operates along the Louisiana Gulf Coast, accessing the coastal and offshore region of Louisiana, the Permian Basin in West Texas and Southeast New Mexico and the Fort Worth Basin in North Texas. Additionally, the company's natural gas liquids logistics and marketing assets are located primarily at Mont Belvieu and Galena Park near Houston, Texas, and in Lake Charles, Louisiana, with terminals and transportation assets across the United States. Targa Resources Partners is managed by its general partner, Targa Resources GP LLC, which is indirectly wholly owned by Targa Resources Corp. (TRGP).
Dividend Yield: 6.37%
Payout Ratio: 176%
5 Yr Dividend Growth: N/A
Enterprise Value/Operating Cash Flow: N/A
Total Debt to Equity: 146.44%
Current Ratio: 1.13
Return on Investment: 6.04%
Click to enlarge


Enterprise Products Partners L.P. (EPD)
Enterprise Products Partners L.P. (Enterprise Products Partners) is a North American midstream energy company providing a range of services to producers and consumers of natural gas, natural gas liquids (NGLs), crude oil, refined products and certain petrochemicals. In addition, the company is engaged in the development of pipeline and other midstream energy infrastructure in the continental United States and Gulf of Mexico.
Dividend Yield: 5.5%
Payout Ratio: 109%
5 Yr Dividend Growth: 7.73%
Enterprise Value / Operating Cash Flow: 16.75
Total Debt to Equity: 123.25%
Current Ratio: 1.01
Return on Investment: 8.06%
Click to enlarge


Buckeye Partners, L.P. (BPL)
Buckeye Partners, L.P. is a publicly traded partnership that owns and operates one of the largest independent refined petroleum products pipeline systems in the United States in terms of volumes delivered, with approximately 5,400 miles of pipeline; owns 69 active refined petroleum products terminals; operates and maintains approximately 2,400 miles of pipeline under agreements with major oil and chemical companies; owns a major natural gas storage facility in northern California; and markets refined petroleum products in certain of the geographic areas served by its pipeline and terminal operations.
Dividend Yield: 5.78%
Payout Ratio: 101%
5 Yr Dividend Growth: 6.86%
Enterprise Value / Operating Cash Flow: 17.93
Total Debt to Equity: 144.97%
Current Ratio: 1.3
Return on Investment: 8.94%
Click to enlarge


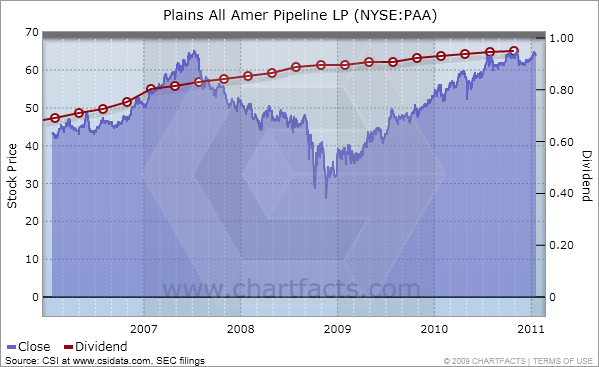
Plains All American Pipeline, L.P. (PAA)

Plains All American Pipeline, L.P. is a publicly traded master limited partnership (“MLP”) engaged in the transportation, storage, terminalling and marketing of crude oil, refined products and liquefied petroleum gas and other natural gas related petroleum products (together "LPG"). Through its general partner interest and majority equity ownership position in PAA Natural Gas Storage, L.P. (PNG), the company also is engaged in the development and operation of natural gas storage facilities.
Dividend Yield: 6.04%
Payout Ratio: 167%
5 Yr Dividend Growth: 9%
Enterprise Value / Operating Cash Flow: 29.24
Total Debt to Equity: 133.5%
Current Ratio: 1.06
Return on Investment: 5.46%
Click to enlarge

Disclosure: I have no positions in any stocks mentioned, and no plans to initiate any positions within the next 72 hours.

4 Reasons to Consider Global Real Estate ETFs

In this day and age, if you want to maximize your portfolio, you’ll diversify with global assets and exchange traded funds (ETFs), and international real estate market is no exception.

Investors should have learned three lessons from our economic upheaval: Bubbles pop, a broad-economic downturn will affect a diversified portfolio and the after effects of a recession will linger, remarks Andy Hyltin for Advisor One.

In an attempt to find new ways to manage and minimize risk, advisors are looking to global real estate investments. By combining U.S. and international real estate in portfolio, an investor may be better able to minimize risk while maximizing returns.

Going abroad may prove beneficial for a number of reasons:
  • Diversify. Going international means exposure to assets with lower correlations to the U.S. economy.
  • Opportunities. The U.S. real estate market is only a portion of the world’s commercial real estate market. The Prudential Real Estate Investors stated that U.S./Canada commercial real estate market was 30.2% of the global market in 2008, and the U.S./Canada share is projected to diminish to 26% by 2028.
  • Emerging markets. The emerging markets will likely continue to grow faster than the matured, developed economies, which will also drive commercial real estate growth in the developing markets.
  • Inflation hedge. Real estate, like other physical assets, could provide some protection against inflation.
There are several options if you’re looking at this market, but to see and analyze them all, drop by the ETF Analyzer. There are some significant differences between the available funds, and the differences can range from cost, country exposure and constituent weightings:
  • First Trust FTSE EPRA/NAREIT Global Real Estate Index Fund (NYSEArca: FFR): FFR holds a large amount of the United States at 34.6%, making it the largest country in this fund. Hong Kong and Japan also have significant weights, which may give you some good exposure to the booming Asian market with a little U.S. diversification for good measure.
  • SPDR Dow Jones International Real Estate ETF (NYSEArca: RWX): Japan, Australia and Hong Kong are the main countries here, but there’s also a fair amount of Europe exposure, too.
  • WisdomTree International Real Estate Fund (NYSEArca: DRW): Hong Kong, Australia, Japan and France round up the top four countries in this fund, which has about 40 more holdings that RWX for some added diversification.
  • Guggenheim China Real Estate ETF (NYSEArca: TAO): TAO is an example of single-country real estate market exposure…or is it? Hong Kong actually accounts for 72% of the ETF, while China makes up 26.9%.
Disclosure I am long RWX shares.

ArcelorMittal And The Steel Catch-Up Trade (MT, VALE, AA, FCX, PKX)

Tickers in this Article: AA, BHP, CAT, DE, FCX, MT, NUE, PKX, STLD, VALE
The financial news often seems to talk about commodities as though they all trade together. The reality, though, is altogether different. While it is true that producers of copper, aluminum, and steel all depend to some extent on a healthy global economy, there can be a great deal of inconsistency between the individual commodities. So while iron giant Vale (Nasdaq: VALE) and aluminum king Alcoa (NYSE:AA) have done well over the past year, Freeport McMoRan (NYSE:FCX) has far surpassed them while ArcelorMittal (NYSE:MT) has been quite the laggard. 

Maybe that begins to change in 2011, and maybe investors should freshen up their due diligence on the largest player in the steel business.
 
A Solid End to a Tough YearAlthough 2010 was hardly a disaster for ArcelorMittal or the steel industry as a whole, the memory of the boom years of 2007 and 2008 are still fresh in many people's minds. With certain commodities like copper hitting all-time highs recently, patience has been a little harder to come by in a steel sector still suffering from a sluggish economic recovery in North America and Western Europe.

Still, ArcelorMittal ended the year on a solid note. Revenue rose 19% from the year-ago level (and 5% sequentially) and topped $20 billion. EBITDA was down 14% from the third quarter, but still higher than the consensus expectation and this quarter's number was arguably cleaner (that is, there were fewer non-operating items influencing the number).

Shipments climbed 3% on a sequential basis, and the company produced 21.6 metric tons of steel in the period. That was enough to give the company a 69% utilization rate - a rate that is below the point where the company can really operate at top efficiency.

Looking Ahead

 Fourth quarter results looked surprisingly good in Europe on a revenue basis (profitability was not so strong), and the performance in the U.S. was OK as well. That said, the company did guide to a stronger first quarter and a utilization rate of around 76%.

The real question that investors in ArcelorMittal, POSCO (NYSE:PKX), Nucor (NYSE:NUE) and Steel Dynamics (Nasdaq:STLD) care about, though, is whether this recovery can continue. For now the answer would seem to be "yes." Construction has not recovered yet in the Western economies, but continues apace in places like China, Brazil and India. Moreover, a lot of steel goes into the heavy-duty equipment produced by the likes of Caterpillar (NYSE:CAT) and Deere (NYSE:DE) and those businesses are seeing very strong revenue and ordering patterns right now.

The Bottom Line 

ArcelorMittal probably does not get all of the credit it is due. Sure, it is "just a steel company," but it is one with a rather remarkable track record of maintaining positive free cash flow and solid free cash flow margins. What's more, the company has led the way in vertical integration and supplies a large percentage of its internal needs for both coal and iron ore - leaving it less exposed to the pricing power of Vale, Teck (NYSE:TCK), BHP Billiton (NYSE:BHP) and so on.

What's more, investors do not always seem to appreciate that there will always be a need for companies like ArcelorMittal. Mini-mills are efficient and have a valuable role to play, but the quality of their steel is not the same and cannot necessarily be used in all of the same applications (though many mini-mill operators like Nucor will add certain components into the mix to improve the quality).
Analysts do not seem completely sold on the strength or sustainability of a recovery in steel, and investors may still be able to find a bargain here. Clearly a global slowdown would be bad news for the sector, as would out-of-control production increases in China (which has happened before). All of that said, ArcelorMittal is a stock that looks like it should be trading closer to the high $40s than the high $30s.

Disclosure I am long CAT, DE and FCX shares.

Dividend Yield, Growth, Safety and a Low Valuation................Need I say More

Chevron Corp. (CVX) is the second largest integrated energy company in the United States, and the world's fourth-largest oil company based on proven reserves. Yet in spite of its immense size, I believe this top quality company has plenty of opportunity to grow worldwide.

Chevron's balance sheet is strong and their cash balances exceeded their debt by over $5.6 billion at the end of 2010. Additionally, we are confident that their strong cash flow generation will allow them to continue to repurchase shares, aggressively invest in their future and continue to grow their dividend as they have for the past 23 years.

I believe that Chevron’s stock is undervalued with a PE ratio of just over ten times earnings, a debt to equity ratio of 10% and the dividend yield of 3%. Over the last decade, since the recession of 2001, Chevron has grown earnings per share by 8.8% per annum.

In contrast, the S&P 500, representing the average company, has only grown earnings at 4.9% per annum. Nevertheless, the current PE ratio of the S&P 500 is 15.6, which is approximately 50% higher than Chevron's PE of 10. Chevron has almost twice the growth rate, almost twice the dividend yield, a debt to equity ratio of 10 versus the S&P 500's 49, and yet ludicrously trades at a discount valuation to the index.

Disclosure I am Long CVX shares.

Northrop Grumman Beats on Improved Performance

Los Angeles-based leading shipbuilder and defense contractor, Northrop Grumman Corporation (NOC), reported impressive fourth quarter 2010 results of $1.27 per share compared with $1.19 in the fourth quarter of 2009. Northrop results also exceeded the Zacks Consensus Estimate of $1.01 for the quarter. The upside in earnings was attributable to better performance across all its segments, barring Electronic Systems.

Fiscal 2010 earnings came in at $6.77 per share, easily beating the Zacks Consensus Estimate of $5.98 and fiscal 2009 earnings of $4.87 per share.

Operational Performance

Sales for the reported quarter decrease 3.6% to $8.6 billion, from $8.9 billion in the year-ago quarter, and was 1.9% lower than the Zacks Consensus Estimate of $8.8 billion. In the reported quarter, earnings from continuing operations increased marginally to $376 million from $375 million in the fourth quarter of 2009. Net earnings in the reported quarter decreased to $376 million compared with $413 million in the prior-year period.

Fiscal 2010 revenue was $34.8 billion versus the Zacks Consensus Estimate of $34.1 billion. Full year revenue also outdid the $33.8 billion generated a year ago.

Segmental Performance
Aerospace Systems

Aerospace Systems quarterly sales declined 4% year over year to $2.7 billion, principally due to lower volume for civil space and missile defense programs; along with fewer working days. Aerospace Systems’ operating income increased 11% to $322 million. Operating margin increased to 12.1% from 10.5% in the year-ago quarter. Higher operating income and margin rate were driven by improved program performances and lower costs.

Electronic Systems 

Electronic Systems sales declined 10% to $1.9 billion, due to fewer working days and lower volume for several programs nearing completion and contracts transitioning to their next phase. This was partially offset by higher volume for targeting systems programs. Electronic Systems’ operating income decreased 0.7% to $272 million. However, operating margin increased to 14.5% from 13.2% year over year. Higher margin rate reflects improved program performance for intelligence, surveillance and reconnaissance programs, including postal automation and improved performance for land and self-protection systems programs.

Information Systems 

Information Systems sales of $2.1 billion were 4.1% lower than the year-ago period, principally due to fewer working days and lower volume for intelligence and defense programs. This was partially offset by higher volume for civil systems programs. Information Systems operating income increased 66.4% to $178 million. Operating margin increased to 8.5% from 4.9% year over year. Higher operating income and margin primarily reflect improved program performance for civil systems programs.

Shipbuilding 

Shipbuilding sales increased 4% to $1.7 billion, driven by higher volume for submarine and expeditionary warfare programs. Operating income also rose 52.3% to $134 million. Similarly, operating margin rose to 7.7% from 5.3% in the year-ago quarter. The rise in operating income and rate reflect higher volume and improved program performance for expeditionary warfare, aircraft carrier and submarine programs.

Technical Services 

Technical Services’ sales increased 6% to $795 million due to higher volume for integrated logistics and modernization programs. Technical Services operating income increased 22.5% to $49 million. Operating margin increased to 6.2% from 5.3% year over year. The improvements in operating income and margin were attributable to higher volume, improved business mix and improved performance.

Financial Condition 

Northrop Grumman ended 2010 with cash and cash equivalents of approximately $3.7 billion compared with $3.3 billion at year-end 2009. Cash generated from operations in 2010 totaled $2.5 billion versus cash from operations of $2.1 billion in the year-ago period. Long-term debt marginally decreased to roughly $4 billion at fiscal 2010 end from $4.2 billion at the end of fiscal 2009.

Outlook

Northrop Grumman’s total order backlog at the end of fiscal 2010 stood at $64.2 billion compared with $69.2 billion at fiscal-end 2009. The company affirmed its revenue guidance for fiscal 2011 to about $27.5 billion. It expects its earnings per share (EPS) to be in the range of $6.40 - $6.60.
Los Angeles-based Northrop Grumman Corporation is one of the world’s leading shipbuilders and the second largest defense contractor in the U.S. The company supplies a broad array of products and services to the U.S. Department of Defense (DoD), including electronic systems, information technology, submarines and surface ships, aircraft, space technology and systems integration services.

Disclosure I am long NOC shares.

Bottom Line: Stick With The Juniors In Gold ETFs (GDX, GDXJ, GLD)

In covering the gold sector for my premium subscribers, I have  noticed something lately. The large-caps really suck! Ok, that is harsh  but it is the truth.


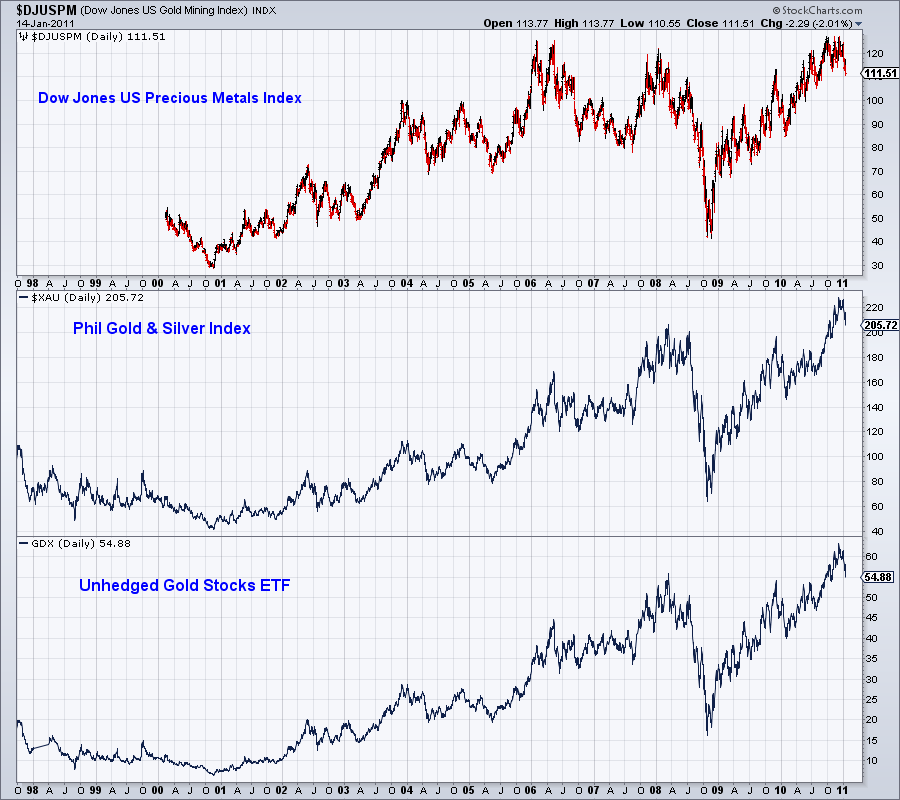
In the chart below I show the large-cap indices. What do you see?


The Dow Jones Precious Metals Index hasn’t gone anywhere for five  years, while Gold has m
ore than doubled. The next two the XAU and the  Market Vectors Gold Miners ETF (NYSE:GDX) are trading right at their  2008 peaks. Since then, I quickly calculate that Gold and Silver are  higher by about 33%.

We all know that the Market Vectors Junior Gold Miners ETF  (NYSE:GDXJ) outperformed GDX in 2010. It wasn’t close and even during  this correction GDXJ is holding up better.
Yet, GDXJ is weighted heavily in some companies that are above $1  Billion in market cap. Where is the “junior” in that? I created my own  index of 25 gold stocks, which are equally weighted and range mostly  from $200-$700 million in market cap.

My junior index against the HUI (GDX follows the HUI) is moving  higher after an 8-year breakout. This chart tells us that the juniors  should outperform strongly in 2011 and likely 2012.


We’ve written about this before but it bears hearing again.

Too often we hear about how gold stocks are cheap and how they are  priced for $1000 Gold or $800 Gold. Just because the HUI/Gold or  XAU/Gold ratio is low doesn’t mean the sector is at a bottom. The  reality is that large gold stocks have consistently underperformed Gold  over time. Take a look at this piece from Steve Saville and his chart which goes back to 1960.

Steve attributes the poor performance to rising costs, management  errors, environmental and political factors but most importantly,  depletion. Just to stay in business gold companies have to consistently  find new deposits, mine those deposits and add to reserves. The larger a  company is, the more difficult it is to do these things. A junior  company can grow by building a few small mines. A large-cap needs to  find huge deposits that can become huge mines. It is simply a more  difficult business for the larger sized companies.

It is critical that investors and speculators take note of all these  factors before partaking in the sector. I fear that the new entrants in  the sector will think they are safe by buying Newmont or Barrick. They  may be less volatile, but history argues you are better off holding Gold  or Silver.

Sure the juniors have already had a fantastic run, but our chart  argues that it may be even better in the next few years. As the bull  market rages on, the herd will naturally become more speculative. The  large players have begun to resort to takeovers and acquisitions. This  will continue and further catalyze the junior sector.  Related ETF: SPDR  Gold Shares ETF (NYSE:GLD)

Disclosure I am long IAU and SLV shares.

A Cheaper Dollar Will Open The Door For These Chinese Investments (UUP, MUB, TCK, CCJ, GMO, PWR)

On January 18th and 19th, the top officials of the two most powerful  nations on Earth are to meet in matters of far reaching significance.   There will be not one but two dinners.  One is to be a grand dinner  of state with all of the military and business leaders of both sides in  attendance.  The other is to be an “intimate” dinner.  Oh, to be a fly  on the wall of that private meeting.


Behind the photo-ops and the speeches there is one basic reality,  China and America are joined inseparably at the hip in a single entity,  which I am calling “The Chinamese Twins.”  As in all such pairings each  head can have their own separate and distinct personalities.  The fact  remains you can call one capitalism and the other communism, but both  heads are mutually dependent on a single life support system.  The world  financial network provides circulatory nourishment to both heads whose  interests are complementary.
 
Washington needs the cheap dollar (NYSE:UUP) to pay off colossal  debts.  China needs to revalue its Yuan to counter domestic inflation in  such areas as food and basic consumer goods.  The Chinese have raised  interest rates and bank reserve rules, to little avail.  At the same  time the Chinese do not want to dry up credit which would impede their  growing economy or slowdown exports.
A current headline in the Wall St. Journal reads, “The Bank Of China  Moves to Make Yuan a Global Currency.”  This will come as no surprise to  goldstocktrades.com readers.  In an article I wrote back in November, I spoke about China and Russia beginning to trade in Yuan and Rubles causing the need for the Yuan to be revalued higher.

The Chinese economy is thriving and they can well afford to revalue  the Yuan higher.  This stronger yuan will make North American resource  assets cheaper and put China in the driver’s seat to control many of the  large undeveloped assets.  At the same time they are buying gold,  silver and uranium assets hand over fist to hedge themselves from a U.S.  dollar decline, in which they own the largest interest.  In 2009 the  Chinese Investment Corporation, a state owned company, took large  ownership positions in Teck Cominco (NYSE:TCK) and Penn West Energy  Trust (NYSE:PWR). Recently in June, China National Nuclear signed a  contract with Cameco (NYSE:CCJ) to supply 23 million pounds of uranium.   Hanlong Investments took a large stake in General Moly (AMEX:GMO), one  of the leading North American molybdenum developers.

They want more  gold and silver to support the Yuan in order to ensure that when the  Yuan becomes the major world currency, it will be more resistant to the  swings encountered by fiat currencies.  Additionally, they also want  more precious metals to buttress its fiscal balance sheet and what they  feel is the eventual replacement of the U.S. Dollar as the world’s  reserve currency.  They are also rapidly developing and modernizing  increasing their use of uranium, potash, molybdenum, rare earths, coal  and oil and gas.

By revaluing the Yuan higher, China will be able to control inflation  and rising costs.  A higher Yuan will also benefit the Chinese  investment side which has already been active making deals in North  America.  The U.S. dollar will significantly be cheaper for the Chinese  which would allow them to acquire North American assets for pennies on  the dollar.  Just recently the Chinese Investment Corporation, whose  focus is to look for investment opportunities abroad opened its first  international branch in Toronto, which is the North American epicenter  of resource  companies.   Its one billion plus people can enjoy more  purchasing power through a higher yuan and a higher standard of living  with a supply of North American natural resources which could fuel their  rapid development.

Beyond the blustering and posturing at these dinners the trade off is  that they want carte blanche to enter more strongly into the heart of  capitalism and the North American resource sector.  Here the Chinese can  get all the gold, silver and natural resource deals they want.  Doors  will quietly swing open and everyone will go home happy.  The Chinese  will have their desired access to buy gold and natural resource stocks,  while The Americans receive a weaker dollar with which to pay off their  burgeoning debts.  If you are thinking that such a Byzantine arrangement  can’t be done, be assured it has all happened before.  During the  1980’s the USSR sold large amounts of gold secretly in New York.  It  took three years to become public knowledge.

Another part of this “Chinamese” agreement concerns rare metals, on  which the Chinese head wants to maintain its strategic grip of over 95%  of the world’s supply.  I feel the U.S. will not make this an issue.   The U.S. will accommodate China in order to persuade them to raise the  Yuan higher and the dollar lower.  I feel this revaluation will be done  in a series of two or three steps in 2011, which should eventually move  precious metals into new high territories and crush the U.S. dollar.   Volatile sell offs in gold and silver like I predicted in November and  December, which we are currently experiencing now, may present long term  precious metal investors with buying opportunities.

Underneath all of the media hype and adversarial stories between  China and America, I read a front page story in the New York Times of  1-17-11, “GE To Share Jet Technology With China In A New Joint  Venture.”  Expect to hear more deals in 2011 in which the Chinese  continue to invest in natural resource assets in North America, while  the U.S. continues to search for a way out of the financial  crisis.   

  We may see further bailouts from the federal government as  many states are in danger of defaulting.  The bankrupt states are  already asking Washington for assistance.  This devaluation of the  dollar that Geithner and Obama are asking for is to help the US pay off  its debts and be able to raise its debt ceiling with cheap devalued  dollars.  This should be bullish for precious metal prices where  investors will seek shelter from soaring government deficits and a loss  of the U.S. dollar as the world reserve currency.  See the iShares  S&P National AMT-Free Muni Bond ETF (NYSE:MUB) chart below:

Disclosure None

U.S. Small Cap Blend ETF Rankings

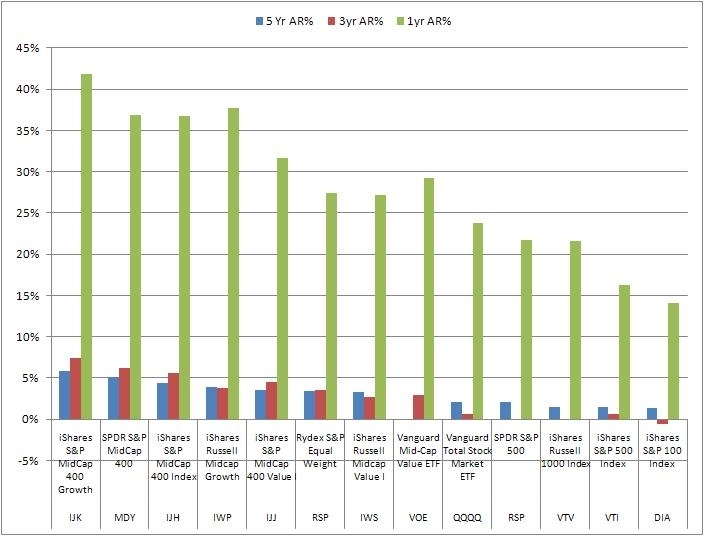
In this article, we  start with our US Small Cap ETF rankings. We have already completed  large and medium cap ETFs and have derived a performance graph for the  ones we selected to potentially use in an ETF plan.

click to enlarge
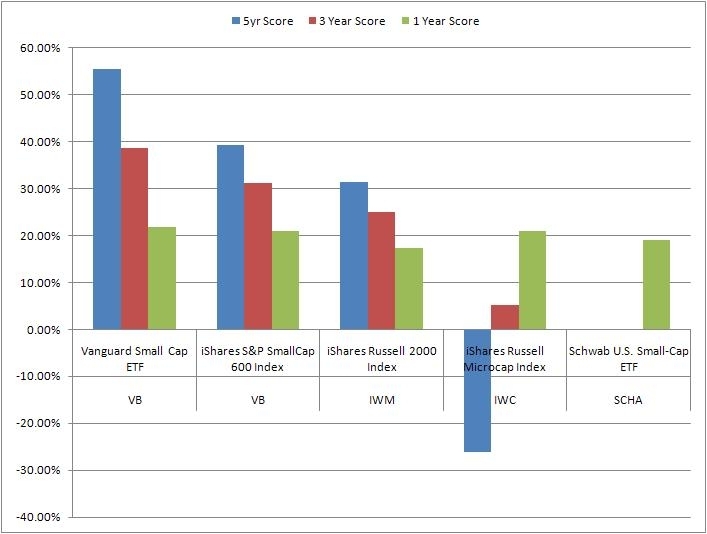
In this article, we move on to small cap blend ETFs with the goal of providing the same ranking.
We rank and determine a cutoff based on trading volume for liquidity and lowtrading friction, then rank them based on their returns and assign a score. We start with a fuller list of small cap blend ETFs:
                                                                                                                                                                                                                                                                                                                                                                                                                                                                                                                                                                                                                                                     
SymbolName
IWMiShares Russell 2000 Index
IJRiShares S&P SmallCap 600 Index
VBVanguard Small Cap ETF
IWCiShares Russell Microcap Index
SCHASchwab U.S. Small-Cap ETF
PRFZPowerShares FTSE RAFI US 1500
JKJiShares Morningstar Small Core
RWJRevenueShares Small Cap
PZIPowerShares Zacks Micro Cap
FYXFirst Trust Small Cap Core Alp
FDMFirst Trust Dow Jones Select M
SLYSPDR S&P 600 Small Cap ETF
WMCRWilshire Micro-Cap ETF
VTWOVanguard Russell 2000 Index ET
PJMPowerShares Dynamic Small Cap
EWRSRydex Russell 2000 Equal Weigh
VIOOVanguard S&P Small-Cap 600 Ind

We now apply trading volume data  for us to be able to reduce the number of ETFs that we examine. We want  to make sure we maximize liquidity and minimize trading friction. We  are going to draw the line at around 200,000 although we will let the  Schwab ETF squeak in just under the bar at around 190,000. This gives us  five ETFs.

                                                                                                                                                                                                                                                                                                                                                                                                                                                           
TickerDescription5 Yr AR%3yr AR%1yr AR%
VBVanguard Small Cap ETF4.00%5.40%37.07%
IJRiShares S&P SmallCap 600 Idx2.83%4.37%35.61%
IWMiShares Russell 2000 Index2.26%3.50%29.63%
IWCiShares Russell Microcap Index-1.89%0.74%35.77%
SCHASchwab U.S. Small-Cap ETF0.00%0.00%32.36%


We will select the top three although VB and IJR seem to be head and shoulders above the rest of the bunch.

                                                                                                                                                                                                                                                                                                                                                                                                                                                                                                                                                                                                                                                                                                                                                                                                                                                                                                                                                                                                            
TickerProperty2004 2005 2006 2007 2008 2009 2010 2011
VBDraw Down(%)12.00 9.04 13.15 13.31 51.92 32.54 20.01 3.69
Return(%)15.29 7.10 15.50 0.96 (37.61)36.39 28.58 3.19
IJRDraw Down(%)11.07 10.94 13.98 14.44 48.42 33.34 19.29 3.58
Return(%)21.43 6.57 14.17 (1.47)(31.70)24.45 27.33 2.13
IWMDraw Down(%)14.41 12.16 14.14 13.90 49.44 32.90 20.09 4.23
Return(%)16.88 3.04 16.95 (2.73)(34.48)26.81 26.49 1.55


So VB and IJR are selected for Mid Cap Blend ETFs.


I have no positions in any stocks mentioned, but plan to initiate a long position in IWM over the next 10 days.

ETF To Watch: Silver Miners ETF (SIL)

2010 was a kind year to mining companies as the prices for their main outputs soared, outpacing gains for the overall market. However, as the calendar turned to 2011 investors began to quickly abandon their bets on the precious metal industry leading to a huge sell-off in a number of key mining names. This trend was especially pronounced in the the silver market where the white metal led on the upside but also was one of the biggest decliners to start the year.


However, the silver market has managed to balance out over the last few weeks posting strong gains thanks to rising inflation fears as well as geopolitical concerns across much of the Middle East. Thanks to this uncertainty, investors in the sector should be paying especially close attention to one of the key companies in the industry, Pan American Silver Corp (PAAS).

PAAS, the Vancouver, Canada-based silver mining giant was scheduled to report its Q4 results after the bell on Tuesday and it also looks to host a conference call during market hours today to discuss the results. Although results were not disclosed at the time of writing, analysts expect the company to post earnings of 46 cents a share, a 15 cent increase from the year ago period, reflecting the rapid increase in the price of silver since the company reported its Q4 2009 numbers


Thanks to this key earnings report from one of the biggest pure silver miners in the world, we have decided to make the Silver Miners ETF (SIL) today’s ETF to watch. The fund tracks the Solactive Global Silver Miners Index which is designed to reflect the performance of the silver mining industry. It is comprised of common stocks, ADRs and GDRs of selected companies globally that are actively engaged in some aspect of the silver mining industry such as silver mining, refining or exploration.

In addition to its 10% weighting in PAAS, the fund also gives high weightings to Industrias Pensoles SAB, Silver Wheaton, and Fresnillio, three other companies that make up at least 10% of SIL’s total assets. Over the past 52 weeks, SIL has surged by a remarkable 65.7% including a 64% gain over the past half year period. However, the fund has lost close to 10% in 2011 but it has posted a solid February, gaining 8.1% back in just two weeks. Should PAAS deliver with solid results and an optimistic outlook, the February run could easily continue into this week as well. If, however, PAAS is unable to match Street expectations, the Canadian company– as well as the broad silver mining industry– could see a quick return to the January 2011 environment in which precious metal miners were under significant pressure.


 Disclosure I am Long SIL shares.