The Deere & Company (NYSE: DE) Board of Directors declared a regular quarterly dividend of $0.35 a share on common stock, $1.40 annualized.
The dividend is payable May 2, 2011, to stockholders of record on March 31, 2011. The ex-dividend date is March 29, 2011.
Yield on the dividend is 1.6%.
Disclosure I am Long DE shares.


Showing posts with label Large Cap. Show all posts
Showing posts with label Large Cap. Show all posts
Thursday, February 24, 2011

Colgate-Palmolive (CL) Increases Quarterly Dividend 9% to $0.58
Colgate-Palmolive Company (NYSE: CL) has declared a quarterly dividend of $0.58 per common share, $2.32 annualized. The dividend is a 9% increase from the current rate of $0.53.
The dividend is to be paid on May 16, 2011 to shareholders of record as of April 26, 2011. The ex-dividend date is April 22, 2011.
Yield on the dividend is 3%.
Disclosure none.
The dividend is to be paid on May 16, 2011 to shareholders of record as of April 26, 2011. The ex-dividend date is April 22, 2011.
Yield on the dividend is 3%.
Disclosure none.
Sunday, February 20, 2011
Caterpillar touts sales growth CAT
The No. 1 maker of earth-moving equipment said retail sales of machinery jumped 49% in Jan., led by a 58% surge in N. America and a 56% increase in Latin America, as those regions started catching up to the recovery that began earlier in Asia. Caterpillar's (CAT) global engine sales rose 23% in Jan. Bucyrus, which is being bought by Cat, said Q4 EPS leapt 48% as sales nearly doubled, helped by an acquisition. Cat climbed 2.4% to 105.86.
Caterpillar Inc. manufactures and sells construction and mining equipment, diesel and natural gas engines, and industrial gas turbines worldwide. Its Machinery business engages in the design, manufacture, marketing, and sale of construction, mining, and forestry machinery, such as track and wheel tractors, track and wheel loaders, pipelayers, motor graders, wheel tractor-scrapers, track and wheel excavators, backhoe loaders, log skidders, log loaders, off-highway trucks, articulated trucks, paving products, skid steer loaders, underground mining equipment, tunnel boring equipment, and related parts.
This business also involves in the design, manufacture, remanufacture, maintenance, and service of rail-related products, as well as offers logistics services. The company's Engines business designs, manufactures, markets, and sells engines for electric power generation systems, locomotives, marine, petroleum, construction, industrial, agricultural, and other applications; and related parts. This business also provides remanufacturing services for other companies. Its Financial Products business provides various financing alternatives to customers and dealers for the company's machinery and engines, solar gas turbines, and other equipment and marine vessels, as well as offers loans to customers and dealers.
This business also provides various forms of insurance to customers and dealers to support the purchase and lease of its equipment. Caterpillar markets its products through distribution centers. The company was formerly known as Caterpillar Tractor Co. and changed its name to Caterpillar Inc. in 1986. Caterpillar was founded in 1925 and is headquartered in Peoria, Illinois.
Disclosure I am Long CAT shares.
Caterpillar Inc. manufactures and sells construction and mining equipment, diesel and natural gas engines, and industrial gas turbines worldwide. Its Machinery business engages in the design, manufacture, marketing, and sale of construction, mining, and forestry machinery, such as track and wheel tractors, track and wheel loaders, pipelayers, motor graders, wheel tractor-scrapers, track and wheel excavators, backhoe loaders, log skidders, log loaders, off-highway trucks, articulated trucks, paving products, skid steer loaders, underground mining equipment, tunnel boring equipment, and related parts.
This business also involves in the design, manufacture, remanufacture, maintenance, and service of rail-related products, as well as offers logistics services. The company's Engines business designs, manufactures, markets, and sells engines for electric power generation systems, locomotives, marine, petroleum, construction, industrial, agricultural, and other applications; and related parts. This business also provides remanufacturing services for other companies. Its Financial Products business provides various financing alternatives to customers and dealers for the company's machinery and engines, solar gas turbines, and other equipment and marine vessels, as well as offers loans to customers and dealers.
This business also provides various forms of insurance to customers and dealers to support the purchase and lease of its equipment. Caterpillar markets its products through distribution centers. The company was formerly known as Caterpillar Tractor Co. and changed its name to Caterpillar Inc. in 1986. Caterpillar was founded in 1925 and is headquartered in Peoria, Illinois.
Disclosure I am Long CAT shares.
Clorox: Why This Dividend Aristocrat Deserves More Respect
Popular brand names at Clorox (CLX) include: Clorox bleach, Green Works, Armor All, STP, Scoop Away cat litters, Kingsford, Hidden Valley, K C Masterpiece dressings and sauces, Brita, Glad bags and Burt’s Bees natural personal care products. 70% of the brands hold a #1 market share and another 18% hold a #2 market share position in their categories.
Fiscal 2010 segment results ($ figures in billions) were:

Dividends have been increased annually since 1977, easily qualifying CLX as an S&P 500 Dividend Aristocrat. Last May, the quarterly dividend was increased to 55¢ ($2.20 annualized).
Recent dividend history:

The markets were disappointed with fiscal Q1 results reported in November 2010, causing the low beta stock to drop $4 in 3 days. CLX said:
Leading household brands at CLX are growing at modest rates in the US and rapidly overseas. In the last 6 years, international sales have been growing 2-3 times the rate of domestic sales. 58% of international sales come from Latin America and only 5% are in Asia (offering large growth potential). International business is expected to account for a substantial portion of future growth
Company EPS guidance for FY2011 remains $4.05-$4.20. Fiscal Q2 results and any guidance updates will be released in the first week of February. Analysts are forecasting EPS of $4.00 in FY2011 and $4.48 for next year. Company finances remain strong, especially after selling the AutoCare businesses which will provide funds to repurchase over 12 million shares of treasury stock in FY2011.
In the last 6 years the stock has largely traded in the $55-65 range while dividends have been growing. At $65, with a P/E of 13X and a yield of 3.4% (the dividend will be raised in May), long term investors who can tolerate current conditions should find CLX an attractive investment.
Disclosure I am long CLX shares.
Fiscal 2010 segment results ($ figures in billions) were:
Dividends have been increased annually since 1977, easily qualifying CLX as an S&P 500 Dividend Aristocrat. Last May, the quarterly dividend was increased to 55¢ ($2.20 annualized).
Recent dividend history:
The markets were disappointed with fiscal Q1 results reported in November 2010, causing the low beta stock to drop $4 in 3 days. CLX said:
We faced a challenging economic environment, as evidenced by category softness in the U.S. along with the impact of the Venezuela currency devaluation," said Chairman Don Knauss. "Late first-quarter shipments were particularly soft and that trend has continued into the first weeks of our second quarter. While we're disappointed not to have delivered stronger first-quarter results, we manage our business for the long term. I believe we're taking the right actions to maintain the long-term health of our brands and help strengthen our categories as the economy recovers.Company guidance given for FY2011 was:
- 0-2% sales growth
- 25-50 basis points gross margin growth (unchanged)
- Diluted EPS from continuing operations in the range of $4.05-$4.20
While second quarter sales results are likely to be a little lower than previously anticipated, as reflected in our updated full year sales outlook, we believe our categories are stabilizing, giving us momentum into the second half of the year, and we should benefit from our recent market share gains. We have a solid new-product pipeline, enabling further growth across a number of categories, and we anticipate improved performance in the second half of the year, including topline growth in the range of 2 percent to 4 percent. Further, the impact of the prior-year Venezuela devaluation and unusually strong year-ago H1N1-related sales will be behind us.Q2 will have a goodwill impairment charge of $250-255 million ($1.78-1.82 diluted EPS) related to Burt's Bees business (with no tax benefit expected). In November 2010, CLX completed the sale of Auto Care businesses with an anticipated after-tax gain of $171 million. Including the $60 million deferred tax benefit in fiscal Q1, the gain on the sale is expected to be $231 million (reflected in discontinued operations).
Leading household brands at CLX are growing at modest rates in the US and rapidly overseas. In the last 6 years, international sales have been growing 2-3 times the rate of domestic sales. 58% of international sales come from Latin America and only 5% are in Asia (offering large growth potential). International business is expected to account for a substantial portion of future growth
Company EPS guidance for FY2011 remains $4.05-$4.20. Fiscal Q2 results and any guidance updates will be released in the first week of February. Analysts are forecasting EPS of $4.00 in FY2011 and $4.48 for next year. Company finances remain strong, especially after selling the AutoCare businesses which will provide funds to repurchase over 12 million shares of treasury stock in FY2011.
In the last 6 years the stock has largely traded in the $55-65 range while dividends have been growing. At $65, with a P/E of 13X and a yield of 3.4% (the dividend will be raised in May), long term investors who can tolerate current conditions should find CLX an attractive investment.
Disclosure I am long CLX shares.
Friday, February 18, 2011
Intel (INTC) to Build $5B Facility in Arizona

The announcement was made by Intel President and CEO Paul Otellini during a visit by President Barack Obama at an Intel facility in Hillsboro, Ore.
“The investment positions our manufacturing network for future growth,” said Brian Krzanich, senior vice president and general manager, Manufacturing and Supply Chain. “This fab will begin operations on a process that will allow us to create transistors with a minimum feature size of 14 nanometers. For Intel, manufacturing serves as the underpinning for our business and allows us to provide customers and consumers with leading-edge products in high volume."
The company said that the construction will begin in the middle of this year and is expected to be completed in 2013.
Disclosure I am long INTC shares.
Abbott (ABT) Increases Quarterly Dividend 9% to $0.48
Abbott (NYSE: ABT) has declared a quarterly dividend of $0.48 per common share, $1.92 annualized. The dividend is a 9% increase from the current rate of $0.44.
The cash dividend is payable May 16, 2011, to shareholders of record at the close of business on April 15, 2011. The ex-dividend date is April 13, 2011.
Yield on the dividend is 4.1%.
Disclosure I am long abt shares.
The cash dividend is payable May 16, 2011, to shareholders of record at the close of business on April 15, 2011. The ex-dividend date is April 13, 2011.
Yield on the dividend is 4.1%.
Disclosure I am long abt shares.
5 Stocks to Profit From the Boom in Rentals
There's a boom going on that many investors haven't heard about: apartment rentals. As more Americans forgo owning homes and decide to rent, rental prices are rising, stoking the earnings of apartment REITs. Since the beginning of 2005, homeownership has been steadily declining from a high of 69.1% and is expected to continue downward. Also, in a survey by the National Apartment Association, 76% of surveyed individuals believed that renting an apartment was a smarter decision than buying a home. As more Americans turn to renting, rents are being driven up:
Rental prices and demand are expected to continue rising as the economy strengthens. One reason is that many children of baby boomers are living with their parents as they look for work. As the economy strengthens and they find jobs, boomer children will provide a rising source of demand for rentals.
Prices will also rise as there has not been much new building in the past three years. It takes time to build new supply, and developers have not added much. Rising rents mean larger profits for apartment REITs. As such, the average apartment REIT has risen more than 40% in the past year, but there is still room to grow. Check out these five apartment REITs that are set to grow profits as rental prices continue to increase:
The average yield of this group is 3%. While that's not as high as mortgage REITs Annaly Capital Management (NYSE: NLY) and Chimera Investments (NYSE: CIM), you have less interest-rate risk with the apartment REITs, as rising interest rates don't hurt them as much and tightening credit spreads don't have an effect on the business. Also, apartment REITs have the potential for real capital appreciation as the value of the owned properties rise in the long run. In the meantime, these apartment REITs provide steady income that will likely rise as rents continue higher.
If housing prices continue falling and rents continue rising, at some point it will be cheaper to buy than rent. At that point, apartment REITs could selectively sell homes to take advantage of rising prices.
Disclosure I am Long NLY and CIM shares.
Rental prices and demand are expected to continue rising as the economy strengthens. One reason is that many children of baby boomers are living with their parents as they look for work. As the economy strengthens and they find jobs, boomer children will provide a rising source of demand for rentals.
 Source:
 Prices will also rise as there has not been much new building in the past three years. It takes time to build new supply, and developers have not added much. Rising rents mean larger profits for apartment REITs. As such, the average apartment REIT has risen more than 40% in the past year, but there is still room to grow. Check out these five apartment REITs that are set to grow profits as rental prices continue to increase:
Company | Apartments | 5-Year Growth Estimate | Yield |
|---|---|---|---|
| BRE Properties (NYSE: BRE) | 21,600 | 5.1% | 3.5% |
| Camden Property Trust (NYSE: CPT) | 64,700 | 7.7% | 3.3% |
| Equity Residential (NYSE: EQR) | 133,00 | 8.9% | 2.7% |
| Post Properties (NYSE: PPS) | 20,200 | 8.4% | 2.2% |
| UDR (NYSE: UDR) | 58,800 | 6.7% | 3.3% |
Sources: Yahoo! Finance and Forbes.com
If housing prices continue falling and rents continue rising, at some point it will be cheaper to buy than rent. At that point, apartment REITs could selectively sell homes to take advantage of rising prices.
Disclosure I am Long NLY and CIM shares.
6 Noteworthy Stocks with Yields Over 4%
If you’re looking to boost the total dividend yield of your portfolio, picking up a few stocks yielding 4%, 5%, or 6% can go a long way. One must be careful, of course, to select companies that have sustainable dividend payouts and that are good long-term investments. Although not every one of these may make for a good investment, and readers should do their own more thorough research, here are six high-yielding companies that are worth being aware of.
Dividend Yield: 6.30%
Latest Annual Dividend Increase: 10%
Payout Ratio: 80%
Total Debt/Equity Ratio: 2.37
Dividend Yield: 6.50%
Latest Annual Dividend Increase: 4%
Payout Ratio: 91%
Total Debt/Equity Ratio: 0.79
Dividend Yield: 4.70%
Latest Annual Dividend Increase: 0%
Payout Ratio: 74%
Total Debt/Equity Ratio: 0.81
Dividend Yield: 4.70%
Latest Annual Dividend Increase: 4%
Payout Ratio: 90%
Total Debt/Equity Ratio: 0.56
Dividend Yield: 4.80%
Latest Annual Dividend Increase: 4%
Payout Ratio: 73%
Total Debt/Equity Ratio: 1.07
Dividend Yield: 4.00%
Latest Annual Dividend Increase: 20%
Payout Ratio: 34%
Total Debt/Equity Ratio: 1.28
Full Disclosure: I am long CTL,PEG and SO.
Altria Group (MO)
Altria is one of the largest tobacco companies in the world, and also has an interest in alcoholic beverages. Depending on the individual investors views on ethical investing, it may or may not meet your requirements for inclusion in your portfolio, but the dividend yield is particularly high. There have been threats to the tobacco industry in many countries including the US for quite a while, and the uncertainty has kept stock valuations quite low. Coupled with the high dividend yields, tobacco investors that have reinvested their dividends have absolutely crushed the market over the last few decades. With a market capitalization of over $50 billion, Altria is the market leader in the United States. A key downside to this stock is Altria’s balance sheet. With a fairly high debt/equity ratio, a moderately low (but very stable) interest coverage ratio, and goodwill that approximately equals shareholder equity, Altria’s balance sheet leaves a lot to be desired. This is partially offset by the consistency of sales and profits, but worth taking into consideration when investing.Dividend Yield: 6.30%
Latest Annual Dividend Increase: 10%
Payout Ratio: 80%
Total Debt/Equity Ratio: 2.37
CenturyLink (CTL)
CenturyLink, created after the acquisition of EMBARQ by CenturyTel, is an integrated communications company with significant operations in the heartland of the United States. The dividend yield has decreased a bit in recent months due to a significant stock rally, but the yield is still quite significant. The high payout ratio makes the dividend a little bit risky, and limits dividend growth. This is typical in this industry, however, and the consistent operations help keep the dividend stable. CenturyLink, like the previously mentioned stock, has a balance sheet that is stable but not particularly appealing.Dividend Yield: 6.50%
Latest Annual Dividend Increase: 4%
Payout Ratio: 91%
Total Debt/Equity Ratio: 0.79
Allete (ALE)
Allete operates in both the energy and real estate industries. The company has significant leverage, but this is to be expected from a utility, and the stock trades at a lower P/B ratio than many other utilities. The utility portion of this company operates mainly in the US Midwest, and they have significant and growing renewable energy sources in the form of wind and hydro power. The company has a significant amount of real estate in Florida, and intends to sell at reasonable prices. A strike against ALE is that the company did not increase the dividend in 2010 over 2009.Dividend Yield: 4.70%
Latest Annual Dividend Increase: 0%
Payout Ratio: 74%
Total Debt/Equity Ratio: 0.81
Leggett and Platt (LEG)
Leggett and Platt is a diversified designer and manufacturer of engineered components for a variety of industries. The balance sheet for the company is mediocre. The valuation and payout ratio are a bit high, but that is partly due to the cyclical nature of the company. As the economy recovers, continued rebound is expected by analysis forecasts. The good news for the company is that it generates extremely impressive cash flows, and in particular, a very healthy level of free cash flow in comparison to their net earnings. This allows the company to not only offer a significant dividend yield, but also to spend a considerable amount of money on share repurchases which fuel dividend growth.Dividend Yield: 4.70%
Latest Annual Dividend Increase: 4%
Payout Ratio: 90%
Total Debt/Equity Ratio: 0.56
The Southern Company (SO)
The Southern Company is an electrical utility operating in Alabama, Florida, Georgia, and Mississippi. SO provides a recession-resistant and substantial dividend to potential investors. Downsides of the company include a weak balance sheet (but fair for a utility), and weak free cash flow. The dividend growth rate is significant considering the yield, and so the combined dividend yield and dividend growth rate is fairly attractive. I do find utilities, as a group, to be fairly expensive in the current market.Dividend Yield: 4.80%
Latest Annual Dividend Increase: 4%
Payout Ratio: 73%
Total Debt/Equity Ratio: 1.07
Lockheed Martin (LMT)
Based on the recently increased dividend and the continually decreasing stock valuation, this large defense and aerospace company now offers a dividend yield in excess of 4%. Revenue, earnings, and cash flow have all performed strongly during the recession. Free cash flow is substantial, and enough to support the significant dividend payout. Unfortunately, like many companies on this list, Lockheed Martin has a balance sheet with a fairly large amount of debt, and goodwill that greatly exceeds shareholder equity. The interest coverage ratio, however, is higher than one might expect, and that’s a sign of stability. The low valuation, substantial dividend growth and yield (even with a low payout ratio), may make this stock reasonably attractive despite the shortcoming of the balance sheet.Dividend Yield: 4.00%
Latest Annual Dividend Increase: 20%
Payout Ratio: 34%
Total Debt/Equity Ratio: 1.28
Full Disclosure: I am long CTL,PEG and SO.
Five Energy MLPs to Consider for Income
A strong case can be made that master limited partnerships (MLPs) will outperform stocks over the next several years. Supposing that this is the case, I thought I would take a look at a few MLPs I believe are positioned to outperform.
MLPs have a different structure from most publicly traded companies. Instead of being structured as corporations, they are structured as limited partnerships. This has some big tax advantages, but can also create some tax filing complications. Be sure that you understand the MLP structure well before buying any units.
To be considered for inclusion in the following list, an MLP was required to be in the midstream business, have a debt/equity ratio below 200%, and have a current ratio above 1. From there I looked for a combination of low valuations, high profitability, high payout ratio adjusted distributions and distribution growth. Below are the five MLPs that I think best fit those criteria.
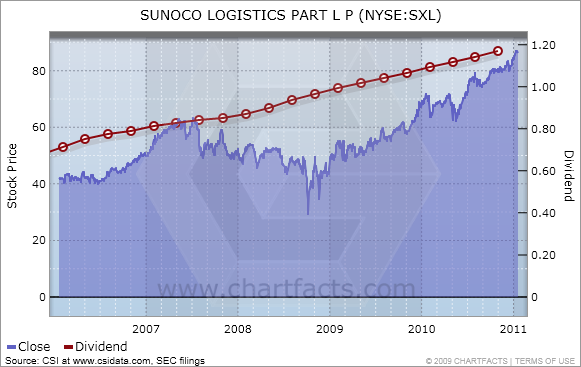
Sunoco Logistics Partners L.P. (SXL)
Sunoco Logistics transports and stores crude oil and refined petroleum products for customers in major activity centers in the Northeast, Midwest and Gulf Coast regions of the United States. The company also buys crude oil from U.S. domestic producers and sells it to refiners.
Dividend Yield: 5.47%
Payout Ratio: 48%
5 Yr Dividend Growth: 12.73%
Enterprise Value/Operating Cash Flow: 18.29
Total Debt to Equity: 140.76%
Current Ratio: 1.16
Return on Investment: 15.97%
Click to enlarge

Targa Resources Partners LP (NGLS)
Targa Resources Partners is a Delaware limited partnership engaged in the business of gathering, compressing, treating, processing and selling natural gas and storing, fractionating, treating, transporting and selling natural gas liquids, or NGLs, and NGL products. The partnership owns an extensive network of integrated gathering pipelines and gas processing plants and currently operates along the Louisiana Gulf Coast, accessing the coastal and offshore region of Louisiana, the Permian Basin in West Texas and Southeast New Mexico and the Fort Worth Basin in North Texas. Additionally, the company's natural gas liquids logistics and marketing assets are located primarily at Mont Belvieu and Galena Park near Houston, Texas, and in Lake Charles, Louisiana, with terminals and transportation assets across the United States. Targa Resources Partners is managed by its general partner, Targa Resources GP LLC, which is indirectly wholly owned by Targa Resources Corp. (TRGP).
Dividend Yield: 6.37%
Payout Ratio: 176%
5 Yr Dividend Growth: N/A
Enterprise Value/Operating Cash Flow: N/A
Total Debt to Equity: 146.44%
Current Ratio: 1.13
Return on Investment: 6.04%
Click to enlarge

Enterprise Products Partners L.P. (EPD)
Enterprise Products Partners L.P. (Enterprise Products Partners) is a North American midstream energy company providing a range of services to producers and consumers of natural gas, natural gas liquids (NGLs), crude oil, refined products and certain petrochemicals. In addition, the company is engaged in the development of pipeline and other midstream energy infrastructure in the continental United States and Gulf of Mexico.
Dividend Yield: 5.5%
Payout Ratio: 109%
5 Yr Dividend Growth: 7.73%
Enterprise Value / Operating Cash Flow: 16.75
Total Debt to Equity: 123.25%
Current Ratio: 1.01
Return on Investment: 8.06%
Click to enlarge

Buckeye Partners, L.P. (BPL)
Buckeye Partners, L.P. is a publicly traded partnership that owns and operates one of the largest independent refined petroleum products pipeline systems in the United States in terms of volumes delivered, with approximately 5,400 miles of pipeline; owns 69 active refined petroleum products terminals; operates and maintains approximately 2,400 miles of pipeline under agreements with major oil and chemical companies; owns a major natural gas storage facility in northern California; and markets refined petroleum products in certain of the geographic areas served by its pipeline and terminal operations.
Dividend Yield: 5.78%
Payout Ratio: 101%
5 Yr Dividend Growth: 6.86%
Enterprise Value / Operating Cash Flow: 17.93
Total Debt to Equity: 144.97%
Current Ratio: 1.3
Return on Investment: 8.94%
Click to enlarge

Plains All American Pipeline, L.P. (PAA)
Plains All American Pipeline, L.P. is a publicly traded master limited partnership (“MLP”) engaged in the transportation, storage, terminalling and marketing of crude oil, refined products and liquefied petroleum gas and other natural gas related petroleum products (together "LPG"). Through its general partner interest and majority equity ownership position in PAA Natural Gas Storage, L.P. (PNG), the company also is engaged in the development and operation of natural gas storage facilities.
Dividend Yield: 6.04%
Payout Ratio: 167%
5 Yr Dividend Growth: 9%
Enterprise Value / Operating Cash Flow: 29.24
Total Debt to Equity: 133.5%
Current Ratio: 1.06
Return on Investment: 5.46%
Click to enlarge

Disclosure: I have no positions in any stocks mentioned, and no plans to initiate any positions within the next 72 hours.
MLPs have a different structure from most publicly traded companies. Instead of being structured as corporations, they are structured as limited partnerships. This has some big tax advantages, but can also create some tax filing complications. Be sure that you understand the MLP structure well before buying any units.
To be considered for inclusion in the following list, an MLP was required to be in the midstream business, have a debt/equity ratio below 200%, and have a current ratio above 1. From there I looked for a combination of low valuations, high profitability, high payout ratio adjusted distributions and distribution growth. Below are the five MLPs that I think best fit those criteria.
Sunoco Logistics Partners L.P. (SXL)
Sunoco Logistics transports and stores crude oil and refined petroleum products for customers in major activity centers in the Northeast, Midwest and Gulf Coast regions of the United States. The company also buys crude oil from U.S. domestic producers and sells it to refiners.
Dividend Yield: 5.47%
Payout Ratio: 48%
5 Yr Dividend Growth: 12.73%
Enterprise Value/Operating Cash Flow: 18.29
Total Debt to Equity: 140.76%
Current Ratio: 1.16
Return on Investment: 15.97%
Click to enlarge
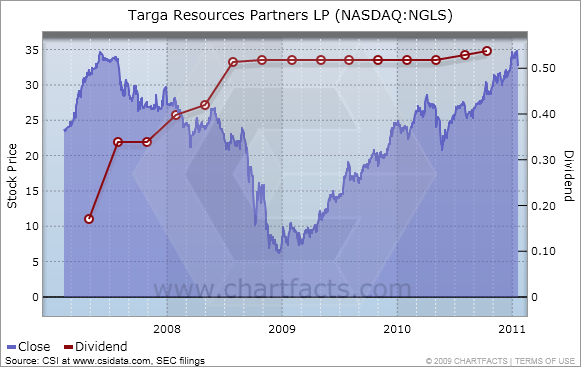
Targa Resources Partners LP (NGLS)
Targa Resources Partners is a Delaware limited partnership engaged in the business of gathering, compressing, treating, processing and selling natural gas and storing, fractionating, treating, transporting and selling natural gas liquids, or NGLs, and NGL products. The partnership owns an extensive network of integrated gathering pipelines and gas processing plants and currently operates along the Louisiana Gulf Coast, accessing the coastal and offshore region of Louisiana, the Permian Basin in West Texas and Southeast New Mexico and the Fort Worth Basin in North Texas. Additionally, the company's natural gas liquids logistics and marketing assets are located primarily at Mont Belvieu and Galena Park near Houston, Texas, and in Lake Charles, Louisiana, with terminals and transportation assets across the United States. Targa Resources Partners is managed by its general partner, Targa Resources GP LLC, which is indirectly wholly owned by Targa Resources Corp. (TRGP).
Dividend Yield: 6.37%
Payout Ratio: 176%
5 Yr Dividend Growth: N/A
Enterprise Value/Operating Cash Flow: N/A
Total Debt to Equity: 146.44%
Current Ratio: 1.13
Return on Investment: 6.04%
Click to enlarge
Enterprise Products Partners L.P. (EPD)
Enterprise Products Partners L.P. (Enterprise Products Partners) is a North American midstream energy company providing a range of services to producers and consumers of natural gas, natural gas liquids (NGLs), crude oil, refined products and certain petrochemicals. In addition, the company is engaged in the development of pipeline and other midstream energy infrastructure in the continental United States and Gulf of Mexico.
Dividend Yield: 5.5%
Payout Ratio: 109%
5 Yr Dividend Growth: 7.73%
Enterprise Value / Operating Cash Flow: 16.75
Total Debt to Equity: 123.25%
Current Ratio: 1.01
Return on Investment: 8.06%
Click to enlarge

Buckeye Partners, L.P. (BPL)
Buckeye Partners, L.P. is a publicly traded partnership that owns and operates one of the largest independent refined petroleum products pipeline systems in the United States in terms of volumes delivered, with approximately 5,400 miles of pipeline; owns 69 active refined petroleum products terminals; operates and maintains approximately 2,400 miles of pipeline under agreements with major oil and chemical companies; owns a major natural gas storage facility in northern California; and markets refined petroleum products in certain of the geographic areas served by its pipeline and terminal operations.
Dividend Yield: 5.78%
Payout Ratio: 101%
5 Yr Dividend Growth: 6.86%
Enterprise Value / Operating Cash Flow: 17.93
Total Debt to Equity: 144.97%
Current Ratio: 1.3
Return on Investment: 8.94%
Click to enlarge

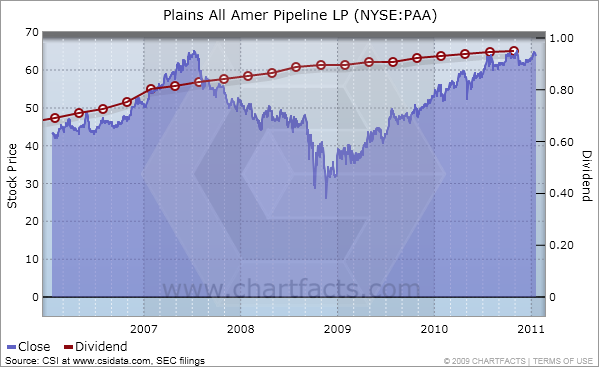
Plains All American Pipeline, L.P. (PAA)
Plains All American Pipeline, L.P. is a publicly traded master limited partnership (“MLP”) engaged in the transportation, storage, terminalling and marketing of crude oil, refined products and liquefied petroleum gas and other natural gas related petroleum products (together "LPG"). Through its general partner interest and majority equity ownership position in PAA Natural Gas Storage, L.P. (PNG), the company also is engaged in the development and operation of natural gas storage facilities.
Dividend Yield: 6.04%
Payout Ratio: 167%
5 Yr Dividend Growth: 9%
Enterprise Value / Operating Cash Flow: 29.24
Total Debt to Equity: 133.5%
Current Ratio: 1.06
Return on Investment: 5.46%
Click to enlarge
Disclosure: I have no positions in any stocks mentioned, and no plans to initiate any positions within the next 72 hours.
ArcelorMittal And The Steel Catch-Up Trade (MT, VALE, AA, FCX, PKX)
The financial news often seems to talk about commodities as though they all trade together. The reality, though, is altogether different. While it is true that producers of copper, aluminum, and steel all depend to some extent on a healthy global economy, there can be a great deal of inconsistency between the individual commodities. So while iron giant Vale (Nasdaq: VALE) and aluminum king Alcoa (NYSE:AA) have done well over the past year, Freeport McMoRan (NYSE:FCX) has far surpassed them while ArcelorMittal (NYSE:MT) has been quite the laggard.
Maybe that begins to change in 2011, and maybe investors should freshen up their due diligence on the largest player in the steel business.
A Solid End to a Tough YearAlthough 2010 was hardly a disaster for ArcelorMittal or the steel industry as a whole, the memory of the boom years of 2007 and 2008 are still fresh in many people's minds. With certain commodities like copper hitting all-time highs recently, patience has been a little harder to come by in a steel sector still suffering from a sluggish economic recovery in North America and Western Europe.
Still, ArcelorMittal ended the year on a solid note. Revenue rose 19% from the year-ago level (and 5% sequentially) and topped $20 billion. EBITDA was down 14% from the third quarter, but still higher than the consensus expectation and this quarter's number was arguably cleaner (that is, there were fewer non-operating items influencing the number).
Shipments climbed 3% on a sequential basis, and the company produced 21.6 metric tons of steel in the period. That was enough to give the company a 69% utilization rate - a rate that is below the point where the company can really operate at top efficiency.
Looking Ahead
Fourth quarter results looked surprisingly good in Europe on a revenue basis (profitability was not so strong), and the performance in the U.S. was OK as well. That said, the company did guide to a stronger first quarter and a utilization rate of around 76%.
The real question that investors in ArcelorMittal, POSCO (NYSE:PKX), Nucor (NYSE:NUE) and Steel Dynamics (Nasdaq:STLD) care about, though, is whether this recovery can continue. For now the answer would seem to be "yes." Construction has not recovered yet in the Western economies, but continues apace in places like China, Brazil and India. Moreover, a lot of steel goes into the heavy-duty equipment produced by the likes of Caterpillar (NYSE:CAT) and Deere (NYSE:DE) and those businesses are seeing very strong revenue and ordering patterns right now.
The Bottom Line
ArcelorMittal probably does not get all of the credit it is due. Sure, it is "just a steel company," but it is one with a rather remarkable track record of maintaining positive free cash flow and solid free cash flow margins. What's more, the company has led the way in vertical integration and supplies a large percentage of its internal needs for both coal and iron ore - leaving it less exposed to the pricing power of Vale, Teck (NYSE:TCK), BHP Billiton (NYSE:BHP) and so on.
What's more, investors do not always seem to appreciate that there will always be a need for companies like ArcelorMittal. Mini-mills are efficient and have a valuable role to play, but the quality of their steel is not the same and cannot necessarily be used in all of the same applications (though many mini-mill operators like Nucor will add certain components into the mix to improve the quality).
Analysts do not seem completely sold on the strength or sustainability of a recovery in steel, and investors may still be able to find a bargain here. Clearly a global slowdown would be bad news for the sector, as would out-of-control production increases in China (which has happened before). All of that said, ArcelorMittal is a stock that looks like it should be trading closer to the high $40s than the high $30s.
Disclosure I am long CAT, DE and FCX shares.
Maybe that begins to change in 2011, and maybe investors should freshen up their due diligence on the largest player in the steel business.
A Solid End to a Tough YearAlthough 2010 was hardly a disaster for ArcelorMittal or the steel industry as a whole, the memory of the boom years of 2007 and 2008 are still fresh in many people's minds. With certain commodities like copper hitting all-time highs recently, patience has been a little harder to come by in a steel sector still suffering from a sluggish economic recovery in North America and Western Europe.
Still, ArcelorMittal ended the year on a solid note. Revenue rose 19% from the year-ago level (and 5% sequentially) and topped $20 billion. EBITDA was down 14% from the third quarter, but still higher than the consensus expectation and this quarter's number was arguably cleaner (that is, there were fewer non-operating items influencing the number).
Shipments climbed 3% on a sequential basis, and the company produced 21.6 metric tons of steel in the period. That was enough to give the company a 69% utilization rate - a rate that is below the point where the company can really operate at top efficiency.
Looking Ahead
Fourth quarter results looked surprisingly good in Europe on a revenue basis (profitability was not so strong), and the performance in the U.S. was OK as well. That said, the company did guide to a stronger first quarter and a utilization rate of around 76%.
The real question that investors in ArcelorMittal, POSCO (NYSE:PKX), Nucor (NYSE:NUE) and Steel Dynamics (Nasdaq:STLD) care about, though, is whether this recovery can continue. For now the answer would seem to be "yes." Construction has not recovered yet in the Western economies, but continues apace in places like China, Brazil and India. Moreover, a lot of steel goes into the heavy-duty equipment produced by the likes of Caterpillar (NYSE:CAT) and Deere (NYSE:DE) and those businesses are seeing very strong revenue and ordering patterns right now.
The Bottom Line
ArcelorMittal probably does not get all of the credit it is due. Sure, it is "just a steel company," but it is one with a rather remarkable track record of maintaining positive free cash flow and solid free cash flow margins. What's more, the company has led the way in vertical integration and supplies a large percentage of its internal needs for both coal and iron ore - leaving it less exposed to the pricing power of Vale, Teck (NYSE:TCK), BHP Billiton (NYSE:BHP) and so on.
What's more, investors do not always seem to appreciate that there will always be a need for companies like ArcelorMittal. Mini-mills are efficient and have a valuable role to play, but the quality of their steel is not the same and cannot necessarily be used in all of the same applications (though many mini-mill operators like Nucor will add certain components into the mix to improve the quality).
Analysts do not seem completely sold on the strength or sustainability of a recovery in steel, and investors may still be able to find a bargain here. Clearly a global slowdown would be bad news for the sector, as would out-of-control production increases in China (which has happened before). All of that said, ArcelorMittal is a stock that looks like it should be trading closer to the high $40s than the high $30s.
Disclosure I am long CAT, DE and FCX shares.
Dividend Yield, Growth, Safety and a Low Valuation................Need I say More
Chevron Corp. (CVX) is the second largest integrated energy company in the United States, and the world's fourth-largest oil company based on proven reserves. Yet in spite of its immense size, I believe this top quality company has plenty of opportunity to grow worldwide.
Chevron's balance sheet is strong and their cash balances exceeded their debt by over $5.6 billion at the end of 2010. Additionally, we are confident that their strong cash flow generation will allow them to continue to repurchase shares, aggressively invest in their future and continue to grow their dividend as they have for the past 23 years.
I believe that Chevron’s stock is undervalued with a PE ratio of just over ten times earnings, a debt to equity ratio of 10% and the dividend yield of 3%. Over the last decade, since the recession of 2001, Chevron has grown earnings per share by 8.8% per annum.
In contrast, the S&P 500, representing the average company, has only grown earnings at 4.9% per annum. Nevertheless, the current PE ratio of the S&P 500 is 15.6, which is approximately 50% higher than Chevron's PE of 10. Chevron has almost twice the growth rate, almost twice the dividend yield, a debt to equity ratio of 10 versus the S&P 500's 49, and yet ludicrously trades at a discount valuation to the index.
Disclosure I am Long CVX shares.
Chevron's balance sheet is strong and their cash balances exceeded their debt by over $5.6 billion at the end of 2010. Additionally, we are confident that their strong cash flow generation will allow them to continue to repurchase shares, aggressively invest in their future and continue to grow their dividend as they have for the past 23 years.
I believe that Chevron’s stock is undervalued with a PE ratio of just over ten times earnings, a debt to equity ratio of 10% and the dividend yield of 3%. Over the last decade, since the recession of 2001, Chevron has grown earnings per share by 8.8% per annum.
In contrast, the S&P 500, representing the average company, has only grown earnings at 4.9% per annum. Nevertheless, the current PE ratio of the S&P 500 is 15.6, which is approximately 50% higher than Chevron's PE of 10. Chevron has almost twice the growth rate, almost twice the dividend yield, a debt to equity ratio of 10 versus the S&P 500's 49, and yet ludicrously trades at a discount valuation to the index.
Disclosure I am Long CVX shares.
Northrop Grumman Beats on Improved Performance
Los Angeles-based leading shipbuilder and defense contractor, Northrop Grumman Corporation (NOC), reported impressive fourth quarter 2010 results of $1.27 per share compared with $1.19 in the fourth quarter of 2009. Northrop results also exceeded the Zacks Consensus Estimate of $1.01 for the quarter. The upside in earnings was attributable to better performance across all its segments, barring Electronic Systems.
Fiscal 2010 earnings came in at $6.77 per share, easily beating the Zacks Consensus Estimate of $5.98 and fiscal 2009 earnings of $4.87 per share.
Operational Performance
Sales for the reported quarter decrease 3.6% to $8.6 billion, from $8.9 billion in the year-ago quarter, and was 1.9% lower than the Zacks Consensus Estimate of $8.8 billion. In the reported quarter, earnings from continuing operations increased marginally to $376 million from $375 million in the fourth quarter of 2009. Net earnings in the reported quarter decreased to $376 million compared with $413 million in the prior-year period.
Fiscal 2010 revenue was $34.8 billion versus the Zacks Consensus Estimate of $34.1 billion. Full year revenue also outdid the $33.8 billion generated a year ago.
Segmental Performance
Aerospace Systems
Aerospace Systems quarterly sales declined 4% year over year to $2.7 billion, principally due to lower volume for civil space and missile defense programs; along with fewer working days. Aerospace Systems’ operating income increased 11% to $322 million. Operating margin increased to 12.1% from 10.5% in the year-ago quarter. Higher operating income and margin rate were driven by improved program performances and lower costs.
Electronic Systems
Electronic Systems sales declined 10% to $1.9 billion, due to fewer working days and lower volume for several programs nearing completion and contracts transitioning to their next phase. This was partially offset by higher volume for targeting systems programs. Electronic Systems’ operating income decreased 0.7% to $272 million. However, operating margin increased to 14.5% from 13.2% year over year. Higher margin rate reflects improved program performance for intelligence, surveillance and reconnaissance programs, including postal automation and improved performance for land and self-protection systems programs.
Information Systems
Information Systems sales of $2.1 billion were 4.1% lower than the year-ago period, principally due to fewer working days and lower volume for intelligence and defense programs. This was partially offset by higher volume for civil systems programs. Information Systems operating income increased 66.4% to $178 million. Operating margin increased to 8.5% from 4.9% year over year. Higher operating income and margin primarily reflect improved program performance for civil systems programs.
Shipbuilding
Shipbuilding sales increased 4% to $1.7 billion, driven by higher volume for submarine and expeditionary warfare programs. Operating income also rose 52.3% to $134 million. Similarly, operating margin rose to 7.7% from 5.3% in the year-ago quarter. The rise in operating income and rate reflect higher volume and improved program performance for expeditionary warfare, aircraft carrier and submarine programs.
Technical Services
Technical Services’ sales increased 6% to $795 million due to higher volume for integrated logistics and modernization programs. Technical Services operating income increased 22.5% to $49 million. Operating margin increased to 6.2% from 5.3% year over year. The improvements in operating income and margin were attributable to higher volume, improved business mix and improved performance.
Financial Condition
Northrop Grumman ended 2010 with cash and cash equivalents of approximately $3.7 billion compared with $3.3 billion at year-end 2009. Cash generated from operations in 2010 totaled $2.5 billion versus cash from operations of $2.1 billion in the year-ago period. Long-term debt marginally decreased to roughly $4 billion at fiscal 2010 end from $4.2 billion at the end of fiscal 2009.
Outlook
Northrop Grumman’s total order backlog at the end of fiscal 2010 stood at $64.2 billion compared with $69.2 billion at fiscal-end 2009. The company affirmed its revenue guidance for fiscal 2011 to about $27.5 billion. It expects its earnings per share (EPS) to be in the range of $6.40 - $6.60.
Los Angeles-based Northrop Grumman Corporation is one of the world’s leading shipbuilders and the second largest defense contractor in the U.S. The company supplies a broad array of products and services to the U.S. Department of Defense (DoD), including electronic systems, information technology, submarines and surface ships, aircraft, space technology and systems integration services.
Disclosure I am long NOC shares.
Fiscal 2010 earnings came in at $6.77 per share, easily beating the Zacks Consensus Estimate of $5.98 and fiscal 2009 earnings of $4.87 per share.
Operational Performance
Sales for the reported quarter decrease 3.6% to $8.6 billion, from $8.9 billion in the year-ago quarter, and was 1.9% lower than the Zacks Consensus Estimate of $8.8 billion. In the reported quarter, earnings from continuing operations increased marginally to $376 million from $375 million in the fourth quarter of 2009. Net earnings in the reported quarter decreased to $376 million compared with $413 million in the prior-year period.
Fiscal 2010 revenue was $34.8 billion versus the Zacks Consensus Estimate of $34.1 billion. Full year revenue also outdid the $33.8 billion generated a year ago.
Segmental Performance
Aerospace Systems
Aerospace Systems quarterly sales declined 4% year over year to $2.7 billion, principally due to lower volume for civil space and missile defense programs; along with fewer working days. Aerospace Systems’ operating income increased 11% to $322 million. Operating margin increased to 12.1% from 10.5% in the year-ago quarter. Higher operating income and margin rate were driven by improved program performances and lower costs.
Electronic Systems
Electronic Systems sales declined 10% to $1.9 billion, due to fewer working days and lower volume for several programs nearing completion and contracts transitioning to their next phase. This was partially offset by higher volume for targeting systems programs. Electronic Systems’ operating income decreased 0.7% to $272 million. However, operating margin increased to 14.5% from 13.2% year over year. Higher margin rate reflects improved program performance for intelligence, surveillance and reconnaissance programs, including postal automation and improved performance for land and self-protection systems programs.
Information Systems
Information Systems sales of $2.1 billion were 4.1% lower than the year-ago period, principally due to fewer working days and lower volume for intelligence and defense programs. This was partially offset by higher volume for civil systems programs. Information Systems operating income increased 66.4% to $178 million. Operating margin increased to 8.5% from 4.9% year over year. Higher operating income and margin primarily reflect improved program performance for civil systems programs.
Shipbuilding
Shipbuilding sales increased 4% to $1.7 billion, driven by higher volume for submarine and expeditionary warfare programs. Operating income also rose 52.3% to $134 million. Similarly, operating margin rose to 7.7% from 5.3% in the year-ago quarter. The rise in operating income and rate reflect higher volume and improved program performance for expeditionary warfare, aircraft carrier and submarine programs.
Technical Services
Technical Services’ sales increased 6% to $795 million due to higher volume for integrated logistics and modernization programs. Technical Services operating income increased 22.5% to $49 million. Operating margin increased to 6.2% from 5.3% year over year. The improvements in operating income and margin were attributable to higher volume, improved business mix and improved performance.
Financial Condition
Northrop Grumman ended 2010 with cash and cash equivalents of approximately $3.7 billion compared with $3.3 billion at year-end 2009. Cash generated from operations in 2010 totaled $2.5 billion versus cash from operations of $2.1 billion in the year-ago period. Long-term debt marginally decreased to roughly $4 billion at fiscal 2010 end from $4.2 billion at the end of fiscal 2009.
Outlook
Northrop Grumman’s total order backlog at the end of fiscal 2010 stood at $64.2 billion compared with $69.2 billion at fiscal-end 2009. The company affirmed its revenue guidance for fiscal 2011 to about $27.5 billion. It expects its earnings per share (EPS) to be in the range of $6.40 - $6.60.
Los Angeles-based Northrop Grumman Corporation is one of the world’s leading shipbuilders and the second largest defense contractor in the U.S. The company supplies a broad array of products and services to the U.S. Department of Defense (DoD), including electronic systems, information technology, submarines and surface ships, aircraft, space technology and systems integration services.
Disclosure I am long NOC shares.
Thursday, February 17, 2011
Why Stocks Outperform Bonds
Stocks provide greater return potential than bonds, but with greater volatility along the way. You have probably heard that statement so many times that you simply accept it as a given. But have you ever stopped to ask why? Why have stocks historically produced higher returns than bonds? Why are bonds typically less volatile? Understanding the reasons behind these trends could help you become a better investor. Read on to learn more.
A Basic Example
Imagine that you are starting up a business. You are the sole owner and the only employee. It will take $2,000 to start operations and you only have $1,000, so you borrow the other $1,000 from a friend, promising to pay that friend $100 per year for the next 10 years, at which time you will repay the original $1,000 loan amount. The first year, after all expenses have been paid, including your own salary, you find that your business has earned $500. You pay your friend the $100 promised and keep the remaining $400. Your friend has earned 10% (100/1000) on his loan to you, but you have earned 40% (400/1,000) on your investment.
The next year does not go as well and after all expenses have been paid you find that the business has only earned $100. You pay that $100 to your friend, who has again experienced a 10% return. You on, the other hand, are left with a 0% return, although your two-year return is still around 20% per year. And so it goes.
With each year, you have the opportunity to earn more or less than the friend who loaned you funds. If the business becomes wildly successful, your return will be exponentially higher than your friend's; if things fall apart, you may lose everything. The loan is a contractual arrangement, so if you have to close up shop, whatever money may be left goes to your friend before it goes to you. As such, your position involves greater risk, but with the opportunity of greater return. If there was no possibility of greater return, there would be no reason for you to take the greater risk.
Expanding the Basic Example
Bonds are essentially loans, as in the example above. Investors loan funds to companies or governments in exchange for a bond that guarantees a fixed return and a promise of the return of the original loan amount, known as the principal, at some point in the future.
Stocks are, in essence, partial ownership rights in the company that entitle the shareholder to share in the earnings that may occur and accrue. Some of these earnings may be paid out immediately in the form of dividends, while the rest of the earnings will be retained. These retained earnings may be used to build a larger infrastructure, giving the company the ability to generate even greater future earnings. Other retained earnings may be held for future uses like buying back company stock or making strategic acquisitions. Regardless of the use, if the earnings continue to rise, the price of the stock will normally rise as well.
Stocks have historically delivered higher returns than bonds because, as in the simplified example above, there is a greater risk that, if the company fails, all of the stockholders' investment will be lost. On the flip side, however, there is a return to stockholders that could potentially dwarf what they could earn investing in bonds. Stock investors will judge the amount they are willing to pay for a share of stock based on the perceived risk and the expected return potential – a return potential that is driven by earnings growth. Being predominantly rational as a group, they will calibrate their investments in a manner that properly compensates them for the excess risk they are taking.
The Causes of Volatility
If a bond pays a known, fixed rate of return, what causes it to fluctuate in value? Several interrelated factors influence volatility:
Inflation and the Time Value of MoneyThe first factor is expected inflation. The lower/higher the inflation expectation, the lower/higher the return or yield bond buyers will demand. This is because of a concept known as the time value of money. The time value of money revolves around the realization that a dollar in the future will buy less than a dollar today because its value is eroded over time by inflation. To determine the value of that future dollar in today's terms, you have to discount its value back over time at some rate.
Discount Rates and Present Value
To calculate the present value of a particular bond, therefore, you must discount the future payments from the bond, both in the form of interest payments and return of principal. The higher the expected inflation, the higher the discount rate that must be used and thus the lower the present value. In addition, the farther out the payment, the longer the discount rate is applied, resulting in a lower present value. Bond payments may be fixed and known, but the constantly changing interest-rate environment subjects their payment streams to a constantly changing discount rate and thus a constantly fluctuating present value. Because the original payment stream of the bond is fixed, the changing bond price will change its current effective yield. As the bond price falls, the effective yield rises; as the bond price rises, the effective yield falls.
The discount rate used is not just a function of inflation expectations. Any risk that the bond issuer may default (fail to make interest payments or return the principal) will call for an increase in the discount rate applied, which will impact the bond's current value. Discount rates are subjective, meaning different investors will be using different rates depending on their own inflation expectations and their own risk assessment. The present value of the bond is the consensus of all these different calculations.
The return from bonds is typically fixed and known, but what is the return from stocks? In its purest form, the relevant return from stocks is known as free cash flow, but in practice the market tends to focus on reported earnings. These earnings are unknown and variable. They may grow quickly or slowly, not at all, or even shrink or go negative. To calculate the present value, you have to make a best guess as to what those future earnings will be. To make matters more difficult, these earnings do not have a fixed life. They may continue for decades and decades. To this ever-changing expected return flow, you are applying an ever-changing discount rate. Stock prices are more volatile than bond prices because calculating the present value involves two constantly changing factors - the earnings stream and the discount rate.
The Pricing Process Is (Usually) Rational
Hopefully you now have a better understanding of why stocks and bonds behave the way they do. This knowledge should place you in a better position to make more informed investment decisions. The pricing of all the thousands and thousands of stocks and bonds is essentially rational. Market participants apply their cumulative knowledge and best estimates as to future inflation, future risks and known or unknown income streams to arrive at present-day valuations. These valuations are constantly fluctuating based on continually changing expectations. In hindsight, one can see that emotions, even in the aggregate, can cause these expectations, and thus valuations, to be incorrect. For the most part, however, they are correct based on what is known at any given point in time.
Conclusion
Bonds will always be less volatile on average than stocks because more is known and certain about their income flow. Over time, stocks should generate greater returns than bonds because there are more unknowns. More unknowns imply greater potential risk. If stocks do not return more, then investors have become truly irrational and taken needless risk with their investment dollars.
A Basic Example
Imagine that you are starting up a business. You are the sole owner and the only employee. It will take $2,000 to start operations and you only have $1,000, so you borrow the other $1,000 from a friend, promising to pay that friend $100 per year for the next 10 years, at which time you will repay the original $1,000 loan amount. The first year, after all expenses have been paid, including your own salary, you find that your business has earned $500. You pay your friend the $100 promised and keep the remaining $400. Your friend has earned 10% (100/1000) on his loan to you, but you have earned 40% (400/1,000) on your investment.
The next year does not go as well and after all expenses have been paid you find that the business has only earned $100. You pay that $100 to your friend, who has again experienced a 10% return. You on, the other hand, are left with a 0% return, although your two-year return is still around 20% per year. And so it goes.
With each year, you have the opportunity to earn more or less than the friend who loaned you funds. If the business becomes wildly successful, your return will be exponentially higher than your friend's; if things fall apart, you may lose everything. The loan is a contractual arrangement, so if you have to close up shop, whatever money may be left goes to your friend before it goes to you. As such, your position involves greater risk, but with the opportunity of greater return. If there was no possibility of greater return, there would be no reason for you to take the greater risk.
Expanding the Basic Example
Bonds are essentially loans, as in the example above. Investors loan funds to companies or governments in exchange for a bond that guarantees a fixed return and a promise of the return of the original loan amount, known as the principal, at some point in the future.
Stocks are, in essence, partial ownership rights in the company that entitle the shareholder to share in the earnings that may occur and accrue. Some of these earnings may be paid out immediately in the form of dividends, while the rest of the earnings will be retained. These retained earnings may be used to build a larger infrastructure, giving the company the ability to generate even greater future earnings. Other retained earnings may be held for future uses like buying back company stock or making strategic acquisitions. Regardless of the use, if the earnings continue to rise, the price of the stock will normally rise as well.
Stocks have historically delivered higher returns than bonds because, as in the simplified example above, there is a greater risk that, if the company fails, all of the stockholders' investment will be lost. On the flip side, however, there is a return to stockholders that could potentially dwarf what they could earn investing in bonds. Stock investors will judge the amount they are willing to pay for a share of stock based on the perceived risk and the expected return potential – a return potential that is driven by earnings growth. Being predominantly rational as a group, they will calibrate their investments in a manner that properly compensates them for the excess risk they are taking.
The Causes of Volatility
If a bond pays a known, fixed rate of return, what causes it to fluctuate in value? Several interrelated factors influence volatility:
Inflation and the Time Value of MoneyThe first factor is expected inflation. The lower/higher the inflation expectation, the lower/higher the return or yield bond buyers will demand. This is because of a concept known as the time value of money. The time value of money revolves around the realization that a dollar in the future will buy less than a dollar today because its value is eroded over time by inflation. To determine the value of that future dollar in today's terms, you have to discount its value back over time at some rate.
Discount Rates and Present Value
To calculate the present value of a particular bond, therefore, you must discount the future payments from the bond, both in the form of interest payments and return of principal. The higher the expected inflation, the higher the discount rate that must be used and thus the lower the present value. In addition, the farther out the payment, the longer the discount rate is applied, resulting in a lower present value. Bond payments may be fixed and known, but the constantly changing interest-rate environment subjects their payment streams to a constantly changing discount rate and thus a constantly fluctuating present value. Because the original payment stream of the bond is fixed, the changing bond price will change its current effective yield. As the bond price falls, the effective yield rises; as the bond price rises, the effective yield falls.
The discount rate used is not just a function of inflation expectations. Any risk that the bond issuer may default (fail to make interest payments or return the principal) will call for an increase in the discount rate applied, which will impact the bond's current value. Discount rates are subjective, meaning different investors will be using different rates depending on their own inflation expectations and their own risk assessment. The present value of the bond is the consensus of all these different calculations.
The return from bonds is typically fixed and known, but what is the return from stocks? In its purest form, the relevant return from stocks is known as free cash flow, but in practice the market tends to focus on reported earnings. These earnings are unknown and variable. They may grow quickly or slowly, not at all, or even shrink or go negative. To calculate the present value, you have to make a best guess as to what those future earnings will be. To make matters more difficult, these earnings do not have a fixed life. They may continue for decades and decades. To this ever-changing expected return flow, you are applying an ever-changing discount rate. Stock prices are more volatile than bond prices because calculating the present value involves two constantly changing factors - the earnings stream and the discount rate.
The Pricing Process Is (Usually) Rational
Hopefully you now have a better understanding of why stocks and bonds behave the way they do. This knowledge should place you in a better position to make more informed investment decisions. The pricing of all the thousands and thousands of stocks and bonds is essentially rational. Market participants apply their cumulative knowledge and best estimates as to future inflation, future risks and known or unknown income streams to arrive at present-day valuations. These valuations are constantly fluctuating based on continually changing expectations. In hindsight, one can see that emotions, even in the aggregate, can cause these expectations, and thus valuations, to be incorrect. For the most part, however, they are correct based on what is known at any given point in time.
Conclusion
Bonds will always be less volatile on average than stocks because more is known and certain about their income flow. Over time, stocks should generate greater returns than bonds because there are more unknowns. More unknowns imply greater potential risk. If stocks do not return more, then investors have become truly irrational and taken needless risk with their investment dollars.
Kraft Stares Down A Catch-22
The J. M. Smucker Company (NYSE: SJM) is trading to the upside in the early session today, following a third quarter earnings report that saw the consumer staple maker top views led by a strong surge in coffee sales.
It is common to find investors and writers talk about food companies like Kraft (NYSE:KFT) in the context of "people always have to eat." While that is true, it overlooks a fairly important point - nobody has to eat their food. There is a big difference between food companies like Kraft and Kellogg (NYSE:K) and the likes of ConAgra (NYSE:CAG) and investors should not just lump all food companies into the same basket. While Kraft certainly has a tough environment to navigate and may have indeed overpaid for Cadbury, this is a food company that merits more than casual attention.
The Quarter that Was
All in all, Kraft delivered a quarter that was a little complicated (due to charges and adjustments and the like), but pretty much consistent with expectations. Sales, though, were a bit higher than the analysts expected. On a reported basis, Kraft served up 5.7% organic revenue growth this quarter, or 4.7% if the effect of an extra week in the quarter is subtracted. The legacy business delivered growth of 5.3%, while Cadbury chipped in about 2.2% organic growth.
Looking at profitability, Kraft's story was like so many others this quarter - mixed. The company's gross margin fell by two points and that appears to be worse than most analysts expected, as the analyst community was apparently surprised by the extent of cost inflation in the market. On a more positive note, the company trimmed down operating expenses better than most expected (and the Cadbury integration is ahead of schedule) and recaptured some of that lost margin, as adjusted operating margin ticked up 20 basis points from the year-ago period. Continuing an oddly consistent trend (at least among the large corporations), Kraft reported lower-than-expected taxes and that helped the company meet the earnings-per-share target for the fourth quarter.
The Road AheadWhile U.S. government officials may not be seeing inflation, Kraft is (remember, things like energy and food input prices apparently are not "real" inflation, so they don't count). To that end, the company lowered guidance for 2011 and talked about input price increases in the high single digits. Although all food companies are in this same boat to some extent, Kraft may have a few extra levers to pull in terms of trimming operating costs and that may help mitigate some of the squeeze. That said, the company is also facing the loss of Starbucks (Nasdaq: SBUX) and that will take some steam out of the results as well.
Kraft also has at least one other factor working in its favor - a broad global presence. In terms of sales, Kraft is near the top of the list of North American food companies that get a sizable percentage of sales from foreign markets. Better still, those markets are growing substantially faster than North America or Western Europe. Is it coincidence that companies like Unilever (NYSE:UL), Coca-Cola (NYSE:KO), Pepsico (NYSE:PEP) and Nestle (Nasdaq:NSRGY) all have solid emerging market exposure and better-than-average returns on capital and growth? Probably not ... and it is a solid argument that Kraft is hanging with the right crowd in that respect.
The Bottom Line
Did Kraft overpay for Cadbury and destroy shareholder value? Maybe so, but it is not readily apparent in the results right now. It may also prove to be the case that Cadbury was a synergistic merger that also expanded Kraft's opportunities in some significant non-U.S. markets. Time will tell.
In the meanwhile, Kraft is going to have to navigate a tricky maze of coping with higher input prices through both restrained price increases and improved internal operating efficiencies. If the company pulls this off, this looks to be one of the better food companies to own. Kraft may not get the benefit of the boom in agriculture (since high prices can actually hurt them more than help) and cost worries might keep a lid on the stock in the short run, but value-oriented investors may find more to like in Kraft shares than they expect.
Disclosure I am Long KFT, UL, PEP, and K shares.
It is common to find investors and writers talk about food companies like Kraft (NYSE:KFT) in the context of "people always have to eat." While that is true, it overlooks a fairly important point - nobody has to eat their food. There is a big difference between food companies like Kraft and Kellogg (NYSE:K) and the likes of ConAgra (NYSE:CAG) and investors should not just lump all food companies into the same basket. While Kraft certainly has a tough environment to navigate and may have indeed overpaid for Cadbury, this is a food company that merits more than casual attention.
The Quarter that Was
All in all, Kraft delivered a quarter that was a little complicated (due to charges and adjustments and the like), but pretty much consistent with expectations. Sales, though, were a bit higher than the analysts expected. On a reported basis, Kraft served up 5.7% organic revenue growth this quarter, or 4.7% if the effect of an extra week in the quarter is subtracted. The legacy business delivered growth of 5.3%, while Cadbury chipped in about 2.2% organic growth.
Looking at profitability, Kraft's story was like so many others this quarter - mixed. The company's gross margin fell by two points and that appears to be worse than most analysts expected, as the analyst community was apparently surprised by the extent of cost inflation in the market. On a more positive note, the company trimmed down operating expenses better than most expected (and the Cadbury integration is ahead of schedule) and recaptured some of that lost margin, as adjusted operating margin ticked up 20 basis points from the year-ago period. Continuing an oddly consistent trend (at least among the large corporations), Kraft reported lower-than-expected taxes and that helped the company meet the earnings-per-share target for the fourth quarter.
The Road AheadWhile U.S. government officials may not be seeing inflation, Kraft is (remember, things like energy and food input prices apparently are not "real" inflation, so they don't count). To that end, the company lowered guidance for 2011 and talked about input price increases in the high single digits. Although all food companies are in this same boat to some extent, Kraft may have a few extra levers to pull in terms of trimming operating costs and that may help mitigate some of the squeeze. That said, the company is also facing the loss of Starbucks (Nasdaq: SBUX) and that will take some steam out of the results as well.
Kraft also has at least one other factor working in its favor - a broad global presence. In terms of sales, Kraft is near the top of the list of North American food companies that get a sizable percentage of sales from foreign markets. Better still, those markets are growing substantially faster than North America or Western Europe. Is it coincidence that companies like Unilever (NYSE:UL), Coca-Cola (NYSE:KO), Pepsico (NYSE:PEP) and Nestle (Nasdaq:NSRGY) all have solid emerging market exposure and better-than-average returns on capital and growth? Probably not ... and it is a solid argument that Kraft is hanging with the right crowd in that respect.
The Bottom Line
Did Kraft overpay for Cadbury and destroy shareholder value? Maybe so, but it is not readily apparent in the results right now. It may also prove to be the case that Cadbury was a synergistic merger that also expanded Kraft's opportunities in some significant non-U.S. markets. Time will tell.
In the meanwhile, Kraft is going to have to navigate a tricky maze of coping with higher input prices through both restrained price increases and improved internal operating efficiencies. If the company pulls this off, this looks to be one of the better food companies to own. Kraft may not get the benefit of the boom in agriculture (since high prices can actually hurt them more than help) and cost worries might keep a lid on the stock in the short run, but value-oriented investors may find more to like in Kraft shares than they expect.
Disclosure I am Long KFT, UL, PEP, and K shares.
Smucker's Profit Falls 2.6% (SJM); Shares Trade Higher
The J. M. Smucker Company (NYSE: SJM) is trading to the upside in the early session today, following a third quarter earnings report that saw the consumer staple maker top views led by a strong surge in coffee sales.
Smucker reported a net income decrease of 3%, from $135.48 million in Q310 to $132 million this quarter. EPS was $1.27 on an adjusted basis though, compared to $1.17 the preceding year.
Net revs in the quarter were up 9%, from $1.206 billion to $1.312 billion.
Overall, the consensus was looking for EPS of $1.26 and revs of $1.25 billion.
The U.S. retail coffee market led the way, with a 18% jump in sales from $471.5 milllion to $554.7 million. The segment benefited from a 13% price hike through their FY11, which offset a 2% volume decline.
Looking ahead, Smucker sees FY11 sales up 4% from FY10. The company also increased the low-end of its outlook from $4.55 - $4.65 to $4.60 - $4.65. The Street is currently looking for EPS of $4.64.
Shares of SJM are up 3.2% today.
Disclosure I am long SJM shares
Smucker reported a net income decrease of 3%, from $135.48 million in Q310 to $132 million this quarter. EPS was $1.27 on an adjusted basis though, compared to $1.17 the preceding year.
Net revs in the quarter were up 9%, from $1.206 billion to $1.312 billion.
Overall, the consensus was looking for EPS of $1.26 and revs of $1.25 billion.
The U.S. retail coffee market led the way, with a 18% jump in sales from $471.5 milllion to $554.7 million. The segment benefited from a 13% price hike through their FY11, which offset a 2% volume decline.
Looking ahead, Smucker sees FY11 sales up 4% from FY10. The company also increased the low-end of its outlook from $4.55 - $4.65 to $4.60 - $4.65. The Street is currently looking for EPS of $4.64.
Shares of SJM are up 3.2% today.
Disclosure I am long SJM shares
Northrop Grumman (NOC) Declares $0.47 Quarterly Dividend
Northrop Grumman Corporation (NYSE: NOC) today declared a quarterly dividend of $0.47 per common share, $1.88 annualized.
The dividend is payable March 12, 2011, to shareholders of record as of the close of business Feb. 28, 2011. The ex-dividend date is February 24, 2011.
Yield on the dividend is 2.8%.
Disclosure I am long NOC shares
The dividend is payable March 12, 2011, to shareholders of record as of the close of business Feb. 28, 2011. The ex-dividend date is February 24, 2011.
Yield on the dividend is 2.8%.
Disclosure I am long NOC shares
Wednesday, February 16, 2011
Clorox (CLX) Declares $0.55 Quarterly Dividend
The Clorox Company (NYSE: CLX) today announced that its board of directors declared a quarterly dividend of $0.55 per common share, $2.20 annualized.
The dividend is payable May 13, 2011, to stockholders of record on April 27, 2011. The ex-dividend date is April 25, 2011.
Yield on the dividend is 3.3%.
Disclosure I am long CLX shares.
The dividend is payable May 13, 2011, to stockholders of record on April 27, 2011. The ex-dividend date is April 25, 2011.
Yield on the dividend is 3.3%.
Disclosure I am long CLX shares.
Tuesday, February 15, 2011
Stanley Black & Decker (SWK) Boosts Qtr. Dividend by 21% to 41c/Share
Stanley Black & Decker (NYSE: SWK) announces a 21% increase in its quarterly dividend to 41c/share.
The dividend is payable on March 22 to shareholders of record on March 2. The ex-dividend date is Feb. 28.
The dividend yield moves from 1.85% to 2.23%.
Disclosure I am Long SWK shares.
The dividend is payable on March 22 to shareholders of record on March 2. The ex-dividend date is Feb. 28.
The dividend yield moves from 1.85% to 2.23%.
Disclosure I am Long SWK shares.
Baxter Int'l (BAX) Declares $0.31 Quarterly Dividend
Baxter International Inc. (NYSE: BAX) has declared a quarterly dividend of $0.31 per Baxter common share, $1.24 annualized.
The dividend is payable on April 1, 2011, to shareholders of record as of the close of business on March 10, 2011. The ex-dividend date is March 8, 2011.
Yield on the dividend is 2.4%
Disclosure I am Long BAX shares.
The dividend is payable on April 1, 2011, to shareholders of record as of the close of business on March 10, 2011. The ex-dividend date is March 8, 2011.
Yield on the dividend is 2.4%
Disclosure I am Long BAX shares.
Monday, February 14, 2011
Build America Bond ETFs May Get a Second Chance
The popular Build America Bonds program may get a second chance at life if President Obama’s budget passes in its current incarnation.
The budget not only calls for the program to be revived, but it wants to make the program permanent. Last year, however, Republicans blocked efforts to extend the program and it could meet with similar resistance this time, says Bloomberg.
Since the program’s end, Build America Bond ETFs got caught up in a selloff and performance suffered. PIMCO Build America Bond Strategy (NYSEArca: BABZ), PowerShares Build America Bond Portfolio (NYSEArca: BAB) and SPDR Nuveen Barclays Capital Build America Bond (NYSEArca: BABS) have all lost between 1.5% and 2% in the last month.
Municipal bond ETFs reacted nicely to the news late last week when another bill to restore the Build America Bonds program was introduced. The iShares S&P National AMT-Free Municipal Bond ETF (NYSEArca: MUB) and the iShares Barclays 20+ Year Treasury Bond ETF (NYSEArca: TLT) were both up last week by 2.3% and 0.7% respectively on the news.
Randall Forsyth for Barrons reports that the bill is the brainchild of Rep. Gerald Connolly, D-Va. His bill proposes to extend the BABs program through 2012 at subsidy rates of 32% in 2011 and 31% in 2012. The ending of the BABs program was a big reason for the large sell-off in the muni market.
Disclosure I am long BAB, BABS and NBB shares.
The budget not only calls for the program to be revived, but it wants to make the program permanent. Last year, however, Republicans blocked efforts to extend the program and it could meet with similar resistance this time, says Bloomberg.
Since the program’s end, Build America Bond ETFs got caught up in a selloff and performance suffered. PIMCO Build America Bond Strategy (NYSEArca: BABZ), PowerShares Build America Bond Portfolio (NYSEArca: BAB) and SPDR Nuveen Barclays Capital Build America Bond (NYSEArca: BABS) have all lost between 1.5% and 2% in the last month.
Municipal bond ETFs reacted nicely to the news late last week when another bill to restore the Build America Bonds program was introduced. The iShares S&P National AMT-Free Municipal Bond ETF (NYSEArca: MUB) and the iShares Barclays 20+ Year Treasury Bond ETF (NYSEArca: TLT) were both up last week by 2.3% and 0.7% respectively on the news.
Randall Forsyth for Barrons reports that the bill is the brainchild of Rep. Gerald Connolly, D-Va. His bill proposes to extend the BABs program through 2012 at subsidy rates of 32% in 2011 and 31% in 2012. The ending of the BABs program was a big reason for the large sell-off in the muni market.
Disclosure I am long BAB, BABS and NBB shares.
Subscribe to:
Posts (Atom)