Seadrill (Nasdaq: SDRL) has declared a quarterly dividend of $0.675 per common share, $2.70 annualized. The dividend is a 44.4% increase from the current rate of $0.4675.
Yield on the dividend is 7.3%.
The Board also declared a special dividend of $0.20 per share.
Yield on the special dividend is 0.5%.
Disclosure I am Long SDRL shares.


Showing posts with label Basic-Materials. Show all posts
Showing posts with label Basic-Materials. Show all posts
Thursday, February 24, 2011

Sunday, February 20, 2011
Top 10 Large Cap Stocks with Highest Dividend Yield: SDRL, CTL, TEF, LO, STD, RAI, MO, T, NGG, NOK (Feb 20, 2011)
Below are the top 10 Large Cap stocks with highest dividend yields for the last 12 months,
SeaDrill Limited (NYSE:SDRL) has the 1st highest dividend yield in this segment of the market. Its current dividend yield is 7.10%. Its dividend payout ratio was 62.61% for the last 12 months.
CenturyLink, Inc. (NYSE:CTL) has the 2nd highest dividend yield in this segment of the market. Its current dividend yield is 7.03%. Its dividend payout ratio was 93.03% for the last 12 months.
Telefonica S.A. (ADR) (NYSE:TEF) has the 3rd highest dividend yield in this segment of the market. Its current dividend yield is 6.81%. Its dividend payout ratio was 63.09% for the last 12 months.
Lorillard Inc. (NYSE:LO) has the 4th highest dividend yield in this segment of the market. Its current dividend yield is 6.54%. Its dividend payout ratio was 62.74% for the last 12 months.
Banco Santander, S.A. (ADR) (NYSE:STD) has the 5th highest dividend yield in this segment of the market. Its current dividend yield is 6.27%. Its dividend payout ratio was 36.77% for the last 12 months.
Reynolds American, Inc. (NYSE:RAI) has the 6th highest dividend yield in this segment of the market. Its current dividend yield is 6.13%. Its dividend payout ratio was 80.72% for the last 12 months.
Altria Group, Inc. (NYSE:MO) has the 7th highest dividend yield in this segment of the market. Its current dividend yield is 6.13%. Its dividend payout ratio was 78.28% for the last 12 months.
AT&T Inc. (NYSE:T) has the 8th highest dividend yield in this segment of the market. Its current dividend yield is 6.02%. Its dividend payout ratio was 52.33% for the last 12 months.
National Grid plc (ADR) (NYSE:NGG) has the 9th highest dividend yield in this segment of the market. Its current dividend yield is 6.00%. Its dividend payout ratio was 65.45% for the last 12 months.
Nokia Corporation (ADR) (NYSE:NOK) has the 10th highest dividend yield in this segment of the market. Its current dividend yield is 5.93%. Its dividend payout ratio was 80.97% for the last 12 months.
Disclosure I am Long SDRL, STD and CTL shares.
SeaDrill Limited (NYSE:SDRL) has the 1st highest dividend yield in this segment of the market. Its current dividend yield is 7.10%. Its dividend payout ratio was 62.61% for the last 12 months.
CenturyLink, Inc. (NYSE:CTL) has the 2nd highest dividend yield in this segment of the market. Its current dividend yield is 7.03%. Its dividend payout ratio was 93.03% for the last 12 months.
Telefonica S.A. (ADR) (NYSE:TEF) has the 3rd highest dividend yield in this segment of the market. Its current dividend yield is 6.81%. Its dividend payout ratio was 63.09% for the last 12 months.
Lorillard Inc. (NYSE:LO) has the 4th highest dividend yield in this segment of the market. Its current dividend yield is 6.54%. Its dividend payout ratio was 62.74% for the last 12 months.
Banco Santander, S.A. (ADR) (NYSE:STD) has the 5th highest dividend yield in this segment of the market. Its current dividend yield is 6.27%. Its dividend payout ratio was 36.77% for the last 12 months.
Reynolds American, Inc. (NYSE:RAI) has the 6th highest dividend yield in this segment of the market. Its current dividend yield is 6.13%. Its dividend payout ratio was 80.72% for the last 12 months.
Altria Group, Inc. (NYSE:MO) has the 7th highest dividend yield in this segment of the market. Its current dividend yield is 6.13%. Its dividend payout ratio was 78.28% for the last 12 months.
AT&T Inc. (NYSE:T) has the 8th highest dividend yield in this segment of the market. Its current dividend yield is 6.02%. Its dividend payout ratio was 52.33% for the last 12 months.
National Grid plc (ADR) (NYSE:NGG) has the 9th highest dividend yield in this segment of the market. Its current dividend yield is 6.00%. Its dividend payout ratio was 65.45% for the last 12 months.
Nokia Corporation (ADR) (NYSE:NOK) has the 10th highest dividend yield in this segment of the market. Its current dividend yield is 5.93%. Its dividend payout ratio was 80.97% for the last 12 months.
Disclosure I am Long SDRL, STD and CTL shares.
MLP ETFs: A Fixed-Income Alternative
Are you looking for a stable and relatively high yield fixed-income asset? Then you may want to take a gander at master limited partnerships (MLPs) exchange traded funds (ETFs), which have only recently come to market.
If you’re unfamiliar with this sector, here’s the short of it: MLPs are a great way to play the energy industry with the added benefit of regular dividend payouts and investment appreciation.
Wells Fargo Senior Energy MLP Analyst Michael Blum believes that MLPs still have plenty of potential, with strong business fundamentals, distribution growth and attractive yields, writes Brian Sylvestor for Investor Ideas.
Those are the basics. Now here’s what you really need to know about this sector that’s more than likely new to you:
If you’re unfamiliar with this sector, here’s the short of it: MLPs are a great way to play the energy industry with the added benefit of regular dividend payouts and investment appreciation.
Wells Fargo Senior Energy MLP Analyst Michael Blum believes that MLPs still have plenty of potential, with strong business fundamentals, distribution growth and attractive yields, writes Brian Sylvestor for Investor Ideas.
Those are the basics. Now here’s what you really need to know about this sector that’s more than likely new to you:
- There are different kinds of MLPs. Exploration and production (E&P) MLPs plays produce oil and natural while gather and processing (G&P) MLPs deal in extracted natural gas liquids (NGLs). G&P MLPs benefit from rising oil prices and low natural gas prices.
- Around 80% of distributions received from MLPs will be tax deferred until the asset is sold. MLPs are also equities, which means there is an upside in the price. Additionally, MLP distributions may change. Blum forecasts a 5% medium distribution growth for the MLP sector over the next couple of years.
- MLPs are slightly sensitive to interest rate changes – a spike in interest rates will cause MLPs to underperform, so watch for any hints of Federal Reserve action on that front. MLPs are also correlated to commodity prices, with a higher correlation toward rising crude oil – certainly an advantageous situation these days.
- Short-term bursts won’t affect MLPs too much because they operate based on volume of oil or natural gas shipped, which provide investors with predictable and stable cash flows, reports Jim Fink for Investing Daily.
- MLPs pay taxes at the partner, or unitholder, level and most of their income flow to their partners in the business, says Christine Benz for Morningstar. By gaining this tax status, MLPs must provide 90% of their income from “qualified sources,” or producing, processing, and transporting energy.
- Since MLP payouts aren’t dividends, investors report income on a K-1 form, as you would with futures-based ETFs.
- Alerian MLP ETF (NYSEArca: AMLP): AMLP launched last September, and it’s the first MLP ETF. Until this fund came along, MLP access could only be had in ETNs. It delivers a nice yield (currently close to 6%), though its performance has been flat since launch. This fund is diversified across three primary MLPs: petroleum transportation, natural gas pipelines and gathering and processing.
- Credit Suisse Cushing 30 MLP Index (NYSEArca: MLPN): MLPN owns 30 companies involved in the energy infrastructure market. Each holding in the fund starts off with a 3.33% weighting after rebalancing quarterly, making it a more equally-weighted fund instead of the more common route of cap-weighting.
- UBS E-TRACS Alerian Natural Gas MLP ETN (NYSEArca: MLPG): MLPG also appeared on the market in March 2010. It has a current yield of 6.23%. Its top 10 components range between 9.7% of the total portfolio (in the case of Enterprise Products Partners) down to 4.4% (in the case of MarkWest Energy Partners).
- JPMorgan Alerian MLP Index ETN (NYSEArca: AMJ): AMJ has a current yield of 5.04%. It’s a tad more concentrated than other MLP funds, however; the top two constituents account for more than 25% of the fund. If concentration is a concern for you, then you might be better off with an equally-weighted fund, or one that simply has its holdings spread out a little more.
Natural Gas ETFs Have a Tough Week
Futures-based natural gas exchange traded funds (ETFs) had a rough go of it last week. Is there any hope for a turnaround?
Maybe not anytime soon. Natural gas last week closed below $4, the lowest level in almost three months. That sank United States Natural Gas (NYSEArca: UNG) by nearly 10% and the newly-launched Teucrium Natural Gas (NYSEArca: NAGS) by 6.6% for the week.
That’s a sharp turnaround from the $13.50 level the fuel saw in the infamous summer of 2008, says The Fort-Worth Star Telegram. But like oil and gas, which also saw sky-high prices then, it swiftly and sharply reversed itself.
Despite the fact that more than 52% of households use natural gas for heat and a record snowfall across the country has them cranking up the furnaces, the market has a big surplus to work through. One encouraging sign is that supplies did fall more than expected last week, says FuturesPros.
A drilling boom in the sector could continue to pressure natural gas prices, although prices have now gotten so low that some companies wonder if the cost of drilling is worth it, says CNN.
Chesapeake Energy (NYSE: CHK) is one such company that abandoned plans to drill for natural gas; it’s 4.1% of First Trust ISE-Revere Natural Gas (NYSEArca: FCG). FCG has fared better lately; though it’s down 0.3% this week, it’s up 3.4% over the last 10 days.
This is one area that has a lot of sorting out left to do. Perhaps if some drillers step back from their efforts to extract natural gas, it will be a positive for prices. For now, they seem to be locked in a downtrend.
Disclosure None
Maybe not anytime soon. Natural gas last week closed below $4, the lowest level in almost three months. That sank United States Natural Gas (NYSEArca: UNG) by nearly 10% and the newly-launched Teucrium Natural Gas (NYSEArca: NAGS) by 6.6% for the week.
That’s a sharp turnaround from the $13.50 level the fuel saw in the infamous summer of 2008, says The Fort-Worth Star Telegram. But like oil and gas, which also saw sky-high prices then, it swiftly and sharply reversed itself.
Despite the fact that more than 52% of households use natural gas for heat and a record snowfall across the country has them cranking up the furnaces, the market has a big surplus to work through. One encouraging sign is that supplies did fall more than expected last week, says FuturesPros.
A drilling boom in the sector could continue to pressure natural gas prices, although prices have now gotten so low that some companies wonder if the cost of drilling is worth it, says CNN.
Chesapeake Energy (NYSE: CHK) is one such company that abandoned plans to drill for natural gas; it’s 4.1% of First Trust ISE-Revere Natural Gas (NYSEArca: FCG). FCG has fared better lately; though it’s down 0.3% this week, it’s up 3.4% over the last 10 days.
This is one area that has a lot of sorting out left to do. Perhaps if some drillers step back from their efforts to extract natural gas, it will be a positive for prices. For now, they seem to be locked in a downtrend.
Disclosure None
Are ETNs Finally Coming Of Age?
The success of a number of exchange-traded notes this year, including two that canvass the market of VIX volatility futures and others offering investors exposure to master limited partnerships, is raising the question of whether ETNs are about to truly take off and become part of every investor’s portfolio.
ETNs, unlike ETFs, offer investors direct exposure to an underlying index, minus expenses. They don’t own underlying baskets of securities like ETFs do, which not only eliminates tracking error but also gives ETNs access to parts of the investment universe that are hard to cover.
The catch -- and it’s been a big one since the market crash of 2008, 2009 -- is that ETNs are unsecured credit obligations backed only by the faith and good credit of their issuers. If an issuer goes under, investors essentially forfeit their entire investment. That chance seemed very remote when ETNs first launched in 2006, and perhaps it’s fading today. Some issuers say investors are getting over fears and are now curious about ETN attributes, including tax advantages.
“I am very confident that we’re going through what I’m calling ‘The Big Thaw’ when it comes to exchange-traded notes, and I think it started with the VIX products that iPath brought,” Bryon Lake, senior product strategy manager at Wheaton, Ill.-based Invesco PowerShares, said in a telephone interview. “We’re getting more questions and more feedback from investors that are looking for and comfortable with the exchange-traded note.”
ETNs represent about $14.5 billion out of the $1 trillion invested in exchange-traded vehicles, according to data compiled by IndexUniverse.com. And, inflows are building momentum:$1.21 billion in 2008; $4.18 billion in 2009 and almost $6 billion in 2010. Moreover, while ETN assets are less than 1.5 percent of total assets in exchange-traded products, the number of ETNs on the market is 131, or almost 12 percent of the 1,101 ETPs now listed in the U.S.
"It's clear that 2010 was the year of the ETN," said Keith Styrcula, chairman and founder of the Structured Products Association, a New York-based trade group with its finger on the pulse of developments in the world of ETNs. "With the proliferation of new issues and new issuers, the ETN came into its own as a liquid, tax-efficient investment vehicle," Styrcula added.
VIX, MLPs, Commodities and Beyond
Much of the recent growth in ETN assets has centered on a few products, notably the iPath S&P 500 VIX Short-Term Futures ETN (NYSEArca:VXX - News) and the iPath S&P 500 VIX Mid-Term Futures ETN (NYSEArca:VXZ - News). The two products now have $1.69 billion and $696 million in assets, respectively. The notes are designed to provide proxy exposure to the CBOE Volatility Index, or VIX, by reflecting the returns of short- and intermediate-term futures on the VIX index. Investors have been attracted to them as a potential hedge against unexpected market turbulence.
“ETNs allow you to track the more esoteric asset classes that would be tougher to do with an ETF, like the VIX, said Rick Romey, president of of ETF Portfolio Solutions, a Kansas-based Registered Investment Advisor. Romey added that his firm has not yet embraced ETNs, in part because of credit-related concerns.
The other big relative newcomer is the JPMorgan Alerian MLP Index ETN (NYSEArca:AMJ - News), a first-to-market exchange-traded note launched originally by Bear Stearns. After treading water for a few years, AMJ has caught on, pulling in more than $1 billion in new cash flow in the past year. It now has $2.26 billion in assets. Investors are attracted to AMJ for its yield, currently around 5 percent. ETNs are a slick vehicle for providing exposure to MLPs, which are nearly impossible to package into a tax-efficient mutual fund or ETF structure.
The third leg of ETN assets is in commodities, an area that includes the oldest and biggest ETN of all, the $2.82 billion iPath Dow Jones-UBS Commodity Total Return ETN (NYSEArca:DJP - News). DJP launched in 2006.
iPath has a broad family of futures-based commodity-related ETNs, which the company says gives investors the ability to play the emerging markets-related commodities boom of the past 10 years in a variety of ways.
“At different times, different commodities become interesting to people,” Tim Edwards, a New York-based iPath product development vice president, told IndexUniverse.com. “Right now, copper is one of them.”
The iPath Dow Jones-UBS Copper Sub Total Return ETN (NYSEArca:JJC - News) has returned about 25 percent this year and 43 percent in the past six months; it is currently the only ETP providing exposure specifically to copper. Two ETFs, the First Trust ISE Global Copper Index Fund (NYSEArca: CU) and the Global X Copper Miners ETF (NYSEArca:COPX - News) own companies that mine copper, though the companies held by the ETFs aren't necessarily exclusively focused on the mining of copper.
The iPath family of ETN also includes securities that allow investors to get exposure to currencies and to position their portfolios for changing interest rates.
Different Tax Treatment
Invesco PowerShares has built on the success of its commodities ETF franchise (including the $5 billion PowerShares DB Commodity Tracking ETF (NYSEArca:DBC - News)) and now offers investors the option of gaining similar exposure in an ETN wrapper. DBC’s ETN counterpart, the PowerShares DB Commodity Long ETN (NYSEArca:DPU - News), had gathered $6.7 million as of Dec. 29.
Apart from the broad-based DPU, the company has replicated ETF strategies using ETNs in four other commodity markets:oil, base metals, agriculture and gold. PowerShares has extended the market on the ETN side with short ETNs and ETNs offering double-exposure long and short.
“The ETN structure provides us some flexibility in order to access markets that may be more difficult to access through the ETF vehicle,” Bryon Lake, the PowerShares executive said. “For example, our double-long and double-short gold ETNs -- (NYSEArca:DGP - News) and (NYSEArca:DZZ - News) -- have seen significant uptick in activity and assets due to all the attention gold has been getting for the last year or so,” Lake said.
There are also potential tax advantages to owning ETNs, which, for commodity ETNs under prevailing IRS interpretations, are taxed like zero-coupon bonds. That means investors don’t owe tax on the note until they sell, the note gets called (if it’s callable), or the note matures. Commodity ETF investors have their positions marked-to-market each year, creating an annual tax bill. ETN investors also have to fill out 1099 tax forms, as opposed to the K1 forms reserved for investors in futures. That’s true even for ETN investors with futures-based holdings.
“We hear from some investors that they would prefer to not get K1s,” said Lake. “And they can generally get the same exposure through ETN vehicles that may offer them a different tax treatment.”
Lingering Doubts
Currently, the biggest issuers of ETNs are firms that thrived during the near-collapse of the financial system in September 2008. Indeed, companies such as iPath ETN issuer Barclays; J.P. Morgan, the company behind the MLP exchange-traded note “AMJ;” and Deutsche Bank, the sponsor of the ETNs marketed by PowerShares, all took advantage of the turmoil their rivals barely survived.
“The market crash got rid of a lot of players in the marketplace. So those who were left standing like Barclays who had the creditworthiness, could then grab a bigger market share,” said Richard Keary, president of Global ETF Advisors LLC, a New York-based firm that helps companies bring exchange-traded products to market.
Recently, however, that has changed. Citigroup recently launched the volatility-related C-Tracks Exchange-Traded Notes Based on the Performance of the Citi Volatility Index (NYSEArca:CVOL - News). The note has attracted $13.8 million in assets since its rollout in mid-November. A slew of other firms are also jumping into the ETN arena, among them Credit Suisse, UBS, the Royal Bank of Scotland as well as a firm called VelocityShares that was formed in part by an executive who helped launch iPath's ETNs
What could that mean? Are investors so complacent that firms, such as CitiGroup or RBS, formerly on life-support can now issue debt products and attract attention? Or have Citi and RBS turned the corner and now is seen as trustworthy? Or, mostly likely, do investors see these as trading products designed for one- or two-day moves, and not as long-haul investments where the credit risk most matters.
Maybe that’s the secret of the ETN rebirth:the notes have focused on providing trading tools rather than long-term investments, reducing the likelihood that investors will be caught in a failed situation.
The uncertainty brings the discussion full circle back to the credit risk implicit in any ETN. After all, three ETN backed by Lehman Brothers closed in September 2008 after the firm declared bankruptcy, and any investor who held to the bitter end lost out.
“I know it’s a long shot,” said Rick Romey, the Kansas-based financial advisor. “The odds of a company going out of business and the ETN holders being left holding the bag is very small probability. But in the last couple of years, we’ve seen a lot of long shots come to fruition and hurt a lot of people.”
Time will tell.
Disclosure I am long AMJ approx 2 weeks ago.
ETNs, unlike ETFs, offer investors direct exposure to an underlying index, minus expenses. They don’t own underlying baskets of securities like ETFs do, which not only eliminates tracking error but also gives ETNs access to parts of the investment universe that are hard to cover.
The catch -- and it’s been a big one since the market crash of 2008, 2009 -- is that ETNs are unsecured credit obligations backed only by the faith and good credit of their issuers. If an issuer goes under, investors essentially forfeit their entire investment. That chance seemed very remote when ETNs first launched in 2006, and perhaps it’s fading today. Some issuers say investors are getting over fears and are now curious about ETN attributes, including tax advantages.
“I am very confident that we’re going through what I’m calling ‘The Big Thaw’ when it comes to exchange-traded notes, and I think it started with the VIX products that iPath brought,” Bryon Lake, senior product strategy manager at Wheaton, Ill.-based Invesco PowerShares, said in a telephone interview. “We’re getting more questions and more feedback from investors that are looking for and comfortable with the exchange-traded note.”
ETNs represent about $14.5 billion out of the $1 trillion invested in exchange-traded vehicles, according to data compiled by IndexUniverse.com. And, inflows are building momentum:$1.21 billion in 2008; $4.18 billion in 2009 and almost $6 billion in 2010. Moreover, while ETN assets are less than 1.5 percent of total assets in exchange-traded products, the number of ETNs on the market is 131, or almost 12 percent of the 1,101 ETPs now listed in the U.S.
"It's clear that 2010 was the year of the ETN," said Keith Styrcula, chairman and founder of the Structured Products Association, a New York-based trade group with its finger on the pulse of developments in the world of ETNs. "With the proliferation of new issues and new issuers, the ETN came into its own as a liquid, tax-efficient investment vehicle," Styrcula added.
| Top Gainers ($, Millions) | 2010's Most Popular ETNs as of Dec. 29 | ||||||
| Ticker | Name | Issuer | Flows | AUM ($, M) | Turnover | ||
| VXX | iPath S&P 500 VIX Short-Term Futures ETN | Barclays Capital | 2,591.07 | 1,692.04 | 119,135.19 | ||
| AMJ | JPMorgan Alerian MLP ETN | JPMorgan Chase | 1,229.85 | 2,255.00 | 6,148.97 | ||
| VXZ | iPath S&P 500 VIX Mid-Term Futures ETN | Barclays Capital | 700.23 | 695.89 | 7,977.51 | ||
| DJP | iPath Dow Jones-UBS Commodity Total Return ETN | Barclays Capital | 322.65 | 2,822.92 | 3,995.61 | ||
| MLPI | UBS E-TRACS Alerian MLP Infrastructure ETN | UBS | 180.51 | 194.27 | 243.62 | ||
| RJI | ELEMENTS Rogers International Commodity - Total Return ETN | ELEMENTS | 141.84 | 662.92 | 872.68 | ||
| MLPN | Credit Suisse Cushing 30 MLP | Credit Suisse | 94.13 | 121.30 | 377.98 | ||
| RJA | ELEMENTS Rogers International Commodity - Agriculture Total Return ETN | ELEMENTS | 90.57 | 517.06 | 890.05 | ||
| UCI | UBS E-TRACS CMCI Total Return ETN | UBS | 81.81 | 129.99 | 54.94 | ||
| JJG | iPath Dow Jones UBS Grains Sub Total Return ETN | Barclays Capital | 80.59 | 188.89 | 973.92 |
VIX, MLPs, Commodities and Beyond
Much of the recent growth in ETN assets has centered on a few products, notably the iPath S&P 500 VIX Short-Term Futures ETN (NYSEArca:VXX - News) and the iPath S&P 500 VIX Mid-Term Futures ETN (NYSEArca:VXZ - News). The two products now have $1.69 billion and $696 million in assets, respectively. The notes are designed to provide proxy exposure to the CBOE Volatility Index, or VIX, by reflecting the returns of short- and intermediate-term futures on the VIX index. Investors have been attracted to them as a potential hedge against unexpected market turbulence.
“ETNs allow you to track the more esoteric asset classes that would be tougher to do with an ETF, like the VIX, said Rick Romey, president of of ETF Portfolio Solutions, a Kansas-based Registered Investment Advisor. Romey added that his firm has not yet embraced ETNs, in part because of credit-related concerns.
The other big relative newcomer is the JPMorgan Alerian MLP Index ETN (NYSEArca:AMJ - News), a first-to-market exchange-traded note launched originally by Bear Stearns. After treading water for a few years, AMJ has caught on, pulling in more than $1 billion in new cash flow in the past year. It now has $2.26 billion in assets. Investors are attracted to AMJ for its yield, currently around 5 percent. ETNs are a slick vehicle for providing exposure to MLPs, which are nearly impossible to package into a tax-efficient mutual fund or ETF structure.
The third leg of ETN assets is in commodities, an area that includes the oldest and biggest ETN of all, the $2.82 billion iPath Dow Jones-UBS Commodity Total Return ETN (NYSEArca:DJP - News). DJP launched in 2006.
iPath has a broad family of futures-based commodity-related ETNs, which the company says gives investors the ability to play the emerging markets-related commodities boom of the past 10 years in a variety of ways.
“At different times, different commodities become interesting to people,” Tim Edwards, a New York-based iPath product development vice president, told IndexUniverse.com. “Right now, copper is one of them.”
The iPath Dow Jones-UBS Copper Sub Total Return ETN (NYSEArca:JJC - News) has returned about 25 percent this year and 43 percent in the past six months; it is currently the only ETP providing exposure specifically to copper. Two ETFs, the First Trust ISE Global Copper Index Fund (NYSEArca: CU) and the Global X Copper Miners ETF (NYSEArca:COPX - News) own companies that mine copper, though the companies held by the ETFs aren't necessarily exclusively focused on the mining of copper.
The iPath family of ETN also includes securities that allow investors to get exposure to currencies and to position their portfolios for changing interest rates.
Different Tax Treatment
Invesco PowerShares has built on the success of its commodities ETF franchise (including the $5 billion PowerShares DB Commodity Tracking ETF (NYSEArca:DBC - News)) and now offers investors the option of gaining similar exposure in an ETN wrapper. DBC’s ETN counterpart, the PowerShares DB Commodity Long ETN (NYSEArca:DPU - News), had gathered $6.7 million as of Dec. 29.
Apart from the broad-based DPU, the company has replicated ETF strategies using ETNs in four other commodity markets:oil, base metals, agriculture and gold. PowerShares has extended the market on the ETN side with short ETNs and ETNs offering double-exposure long and short.
“The ETN structure provides us some flexibility in order to access markets that may be more difficult to access through the ETF vehicle,” Bryon Lake, the PowerShares executive said. “For example, our double-long and double-short gold ETNs -- (NYSEArca:DGP - News) and (NYSEArca:DZZ - News) -- have seen significant uptick in activity and assets due to all the attention gold has been getting for the last year or so,” Lake said.
There are also potential tax advantages to owning ETNs, which, for commodity ETNs under prevailing IRS interpretations, are taxed like zero-coupon bonds. That means investors don’t owe tax on the note until they sell, the note gets called (if it’s callable), or the note matures. Commodity ETF investors have their positions marked-to-market each year, creating an annual tax bill. ETN investors also have to fill out 1099 tax forms, as opposed to the K1 forms reserved for investors in futures. That’s true even for ETN investors with futures-based holdings.
“We hear from some investors that they would prefer to not get K1s,” said Lake. “And they can generally get the same exposure through ETN vehicles that may offer them a different tax treatment.”
Lingering Doubts
Currently, the biggest issuers of ETNs are firms that thrived during the near-collapse of the financial system in September 2008. Indeed, companies such as iPath ETN issuer Barclays; J.P. Morgan, the company behind the MLP exchange-traded note “AMJ;” and Deutsche Bank, the sponsor of the ETNs marketed by PowerShares, all took advantage of the turmoil their rivals barely survived.
“The market crash got rid of a lot of players in the marketplace. So those who were left standing like Barclays who had the creditworthiness, could then grab a bigger market share,” said Richard Keary, president of Global ETF Advisors LLC, a New York-based firm that helps companies bring exchange-traded products to market.
Recently, however, that has changed. Citigroup recently launched the volatility-related C-Tracks Exchange-Traded Notes Based on the Performance of the Citi Volatility Index (NYSEArca:CVOL - News). The note has attracted $13.8 million in assets since its rollout in mid-November. A slew of other firms are also jumping into the ETN arena, among them Credit Suisse, UBS, the Royal Bank of Scotland as well as a firm called VelocityShares that was formed in part by an executive who helped launch iPath's ETNs
What could that mean? Are investors so complacent that firms, such as CitiGroup or RBS, formerly on life-support can now issue debt products and attract attention? Or have Citi and RBS turned the corner and now is seen as trustworthy? Or, mostly likely, do investors see these as trading products designed for one- or two-day moves, and not as long-haul investments where the credit risk most matters.
Maybe that’s the secret of the ETN rebirth:the notes have focused on providing trading tools rather than long-term investments, reducing the likelihood that investors will be caught in a failed situation.
The uncertainty brings the discussion full circle back to the credit risk implicit in any ETN. After all, three ETN backed by Lehman Brothers closed in September 2008 after the firm declared bankruptcy, and any investor who held to the bitter end lost out.
“I know it’s a long shot,” said Rick Romey, the Kansas-based financial advisor. “The odds of a company going out of business and the ETN holders being left holding the bag is very small probability. But in the last couple of years, we’ve seen a lot of long shots come to fruition and hurt a lot of people.”
Time will tell.
Disclosure I am long AMJ approx 2 weeks ago.
Saturday, February 19, 2011
Questar approved a 9% increase in the quarterly common-stock dividend to $0.1525 (STR)

The dividend is payable on March 21 to shareholders of record on March 4. The ex-dividend date is March 2.
The dividend yield moves from 3.11% to 3.39%.
Questar Corporation, a natural gas-focused energy company, through its subsidiaries, engages in the gas and oil exploration and production, midstream field services, energy marketing, interstate gas transportation, and retail gas distribution businesses. It acquires, explores for, develops, and produces natural gas, oil, and natural gas liquids in the Rocky Mountain region of Wyoming, Utah, Colorado, and North Dakota, as well as the Midcontinent region of Oklahoma, Texas, and Louisiana; and manages, develops, and produces reserves for gas utility and sells crude-oil production from certain oil-producing properties. The company also provides midstream field services, including natural gas-gathering and processing for affiliates and third parties; markets equity and third-party natural gas, oil, and natural gas liquids to refiners, remarketers, and other companies; provides risk-management services; and owns and operates an underground gas-storage reservoir.
In addition, it offers interstate natural gas transportation and underground storage services; gas-processing services for third parties; interstate natural gas transportation and storage, and other energy services; and retail natural gas distribution services. As of December 31, 2009, it had estimated proved reserves of 2,746.9 Bcfe; served 898,558 sales and transportation customers; owned 2,568 miles of interstate pipeline with total firm capacity commitments of 4,243 Mdth per day; and owned and operated the 488-mile Southern Trails Pipeline from the Blanco hub in the San Juan Basin to the California state line. Questar Corporation was founded in 1922 and is headquartered in Salt Lake City, Utah.
Disclosure I am Long STR shares.
Friday, February 18, 2011
CF Industries Q4 Profit Beats View on Rising Fertilizer Demand (CF)
Fertilizer maker CF Industries Holdings, Inc. (CF) late Thursday posted better-than-expected fourth quarter earnings results, aided by strong demand for its products and the addition of sales from its acquisition of rival Terra Nitrogen(TNH).
The Deerfield, IL-based company reported fourth quarter net income of $200.3 million, or $2.78 per share, compared with $51.4 million, or $1.04 per share, in the year-ago period. Excluding one-time items, adjusted profit was $2.65 per share.
Revenue more than doubled from last year to $1.24 billion.
On average, Wall Street analysts expected a smaller profit of $2.56 per share, on lower revenue of $1.19 billion.
CF Industries shares fell 81 cents, or -0.6%, in premarket trading Friday.
The Bottom Line
CF Industries (CF) has been an “aggressive” recommendation, but is not a name I think yield-focused investors should be considering. The company has a .27% dividend yield, based on last night’s closing stock price of $147.81.
Disclosure I am Long TNH shares.
The Deerfield, IL-based company reported fourth quarter net income of $200.3 million, or $2.78 per share, compared with $51.4 million, or $1.04 per share, in the year-ago period. Excluding one-time items, adjusted profit was $2.65 per share.
Revenue more than doubled from last year to $1.24 billion.
On average, Wall Street analysts expected a smaller profit of $2.56 per share, on lower revenue of $1.19 billion.
CF Industries shares fell 81 cents, or -0.6%, in premarket trading Friday.
The Bottom Line
CF Industries (CF) has been an “aggressive” recommendation, but is not a name I think yield-focused investors should be considering. The company has a .27% dividend yield, based on last night’s closing stock price of $147.81.
Disclosure I am Long TNH shares.
ETF Showdown: Timber Time
In the world of timber ETFs there are two. Yep, just two. Not even an ETN, which is strange considering there are timber futures trading here in the U.S., but we've got to focus on the options we do have access to and these two funds will be the focus of this week's ETF Showdown.
Like gold, coffee or oil, timber is a commodity and like so many other commodities, emerging markets demand is the driving force in the timber market. As ETFTrends recently pointed out, China is gobbling up pallets and packing materials, pulp and paper at rapid pace with no signs of a change in trend anytime soon.
Sounds like a good time to compare and contrast the Guggenheim Timber ETF (NYSE: CUT) and the iShares S&P Global Timber Index Fund (NYSE: WOOD). Kudos to both Guggenheim and iShares for coming up with appropriate tickers. Making distinctions between CUT and WOOD is critical for investors because over the past year, the performance of these ETFs is identical as both are up 30%.
First, we see that CUT trades for less than half the price of WOOD, allowing a trader to accumulate more than double the amount of shares for the same outlay of capital. So there's a point in CUT''s favor. CUT also features the better liquidity with an average daily trading volume for the past three months that is better than quadruple what WOOD features.
On the other hand, WOOD does offer the better expense ratio at 0.48% compared to 0.65% for CUT. Obviously both funds are going to have some of the same holdings, but the allocations are different because WOOD is nearly half allocated to the U.S. while about a quarter of CUT's allocation is devoted to the U.S. Either way, you'll see Rayoneir (NYSE: RYN), Weyerhaeuser (NYSE: WY) and MeadWestvaco (NYSE: MV) among the top 10-holdings for both ETFs. International Paper (NYSE: IP )is found among CUT's top-10, but not WOOD's.
Making a decision between these two funds is hard, but it is clear timber exposure is worth a look now. Over the last 30 years or more, there has been little or no positive correlation between the returns generated from timberland and those from either fixed-income or equity assets, according to Hard Assets Investor.
A long-term hold might want to opt for WOOD because of the lower expense ratio, but an active trader should go for CUT because of the of the superior liquidity. Consider this showdown a draw with a slight edge to CUT.
Like gold, coffee or oil, timber is a commodity and like so many other commodities, emerging markets demand is the driving force in the timber market. As ETFTrends recently pointed out, China is gobbling up pallets and packing materials, pulp and paper at rapid pace with no signs of a change in trend anytime soon.
Sounds like a good time to compare and contrast the Guggenheim Timber ETF (NYSE: CUT) and the iShares S&P Global Timber Index Fund (NYSE: WOOD). Kudos to both Guggenheim and iShares for coming up with appropriate tickers. Making distinctions between CUT and WOOD is critical for investors because over the past year, the performance of these ETFs is identical as both are up 30%.
First, we see that CUT trades for less than half the price of WOOD, allowing a trader to accumulate more than double the amount of shares for the same outlay of capital. So there's a point in CUT''s favor. CUT also features the better liquidity with an average daily trading volume for the past three months that is better than quadruple what WOOD features.
On the other hand, WOOD does offer the better expense ratio at 0.48% compared to 0.65% for CUT. Obviously both funds are going to have some of the same holdings, but the allocations are different because WOOD is nearly half allocated to the U.S. while about a quarter of CUT's allocation is devoted to the U.S. Either way, you'll see Rayoneir (NYSE: RYN), Weyerhaeuser (NYSE: WY) and MeadWestvaco (NYSE: MV) among the top 10-holdings for both ETFs. International Paper (NYSE: IP )is found among CUT's top-10, but not WOOD's.
Making a decision between these two funds is hard, but it is clear timber exposure is worth a look now. Over the last 30 years or more, there has been little or no positive correlation between the returns generated from timberland and those from either fixed-income or equity assets, according to Hard Assets Investor.
A long-term hold might want to opt for WOOD because of the lower expense ratio, but an active trader should go for CUT because of the of the superior liquidity. Consider this showdown a draw with a slight edge to CUT.
China's Serious Coal Problem
Chinese President Hu Jintao meets with President Obama today in Washington DC. The two presidents are supposed to have a private lunch and then discuss a variety of topics including trade, military, North Korea, Iran, human rights, the dollar, the yuan and the weather, no doubt.
As the east coast is being hammered with a wintry mix of sleet, freezing rain, snow and ice, you might expect the topic of coal to come up. After all, a majority of electricity in the United States and China is provided by coal. And for the past few years, China has started to import coal -- mostly from Australia.
As a result, China's domestic coal companies are practically minting money. They can't produce coal fast enough, because no matter how much coal they bring to market, there's a near-guarantee that they'll be able to sell it for top dollar.
They don't have to worry about anything except for increasing production. And now, with floods in Australia, the amount of coal being shipped to China has decreased substantially. Coal prices have responded favorably -- rising from $89 per metric ton up to over $120 per metric ton -- with no signs of stopping:
 It's been a year since my boss, Ian Wyatt, recommended one small Chinese coal company to subscribers of his research service Energy World Profits. And folks who bought this company when he recommended it are now sitting on 81% gains.
Today, Ian still targets an even higher price for this company -- and it's still a buy.
I'm talking about Puda Coal(PUDA_).

A lack of Australian coal puts this company in an even better position. Even when Australian coal production resumes, the market will have to play catch up. There's no substitute for coal in China, and they've been increasing their imports.
So my recommendation would be to buy Chinese coal companies like Puda -- with domestic production. Even if China's coal demand is reduced by half, they'll still need to tap into their domestic supply. It's relatively cheaper than Australian coal, it's readily available and it's extremely important to China's growth and sustainability.
I'd recommend picking up shares of Puda under $20. That's about a 50% upside from today's price.
Disclosure None
As the east coast is being hammered with a wintry mix of sleet, freezing rain, snow and ice, you might expect the topic of coal to come up. After all, a majority of electricity in the United States and China is provided by coal. And for the past few years, China has started to import coal -- mostly from Australia.
As a result, China's domestic coal companies are practically minting money. They can't produce coal fast enough, because no matter how much coal they bring to market, there's a near-guarantee that they'll be able to sell it for top dollar.
They don't have to worry about anything except for increasing production. And now, with floods in Australia, the amount of coal being shipped to China has decreased substantially. Coal prices have responded favorably -- rising from $89 per metric ton up to over $120 per metric ton -- with no signs of stopping:
Today, Ian still targets an even higher price for this company -- and it's still a buy.
I'm talking about Puda Coal(PUDA_).
A lack of Australian coal puts this company in an even better position. Even when Australian coal production resumes, the market will have to play catch up. There's no substitute for coal in China, and they've been increasing their imports.
So my recommendation would be to buy Chinese coal companies like Puda -- with domestic production. Even if China's coal demand is reduced by half, they'll still need to tap into their domestic supply. It's relatively cheaper than Australian coal, it's readily available and it's extremely important to China's growth and sustainability.
I'd recommend picking up shares of Puda under $20. That's about a 50% upside from today's price.
Disclosure None
Commodity ETFs and Contango
Commodity exchange traded funds (ETFs) have become one of the most popular fund types with investors. They don’t all work the same, however, and before you dive in, you need to understand this market in a bit of detail to avoid getting surprised, or worse, burned.
Michael Iachini for Charles Schwab reports that in order to understand how commodity ETFs work, you’ll need to know what it’s tracking and how it’s tracking it.
As ETF providers become more aware of these issues, however, they’re structuring their strategies around mitigating the impact of contango. Backwardation is the opposite phenomenon, Joyce Hanson for Advisor One reports.
There are two key types of commodity ETFs that give exposure to prices:
Michael Iachini for Charles Schwab reports that in order to understand how commodity ETFs work, you’ll need to know what it’s tracking and how it’s tracking it.
- Spot Price: The spot price of a commodity is the price that it is trading at right now. If you wanted to buy a barrel of oil or a bushel of corn to take home today, you would pay the spot price.
- Futures Price: The futures price is the price you would pay today for the right to receive the commodity at some point in the future (for example, three months from today). With a futures contract, you’re locking in a price today rather than waiting to see what the spot price will be at some point in the future and then making the purchase at that price. It’s most advantageous, of course, to see the futures price go up after you’ve locked in a lower price.
As ETF providers become more aware of these issues, however, they’re structuring their strategies around mitigating the impact of contango. Backwardation is the opposite phenomenon, Joyce Hanson for Advisor One reports.
There are two key types of commodity ETFs that give exposure to prices:
- Physical ETFs: If your ETF holds the physical commodity, the value of your ETF shares will move with the spot price of the commodity, though the price could also be affected by security issues and the cost of storing the commodity itself. ETFS Physical Swiss Gold (NYSEArca: SGOL) is one of the growing number of such funds; each share is backed by a fractional ownership in gold bars, which are stored in secure vaults around the world.
- Futures Contracts: Other ETFs hold baskets of futures contracts and never take possession of the physical commodity. This is the most common commodity ETF structure, whether it’s for oil, agricultural commodities, broad baskets of commodities or even some precious metal ETFs. Storing oil or wheat is more difficult than storing bullion, which is why these ETFs don’t just hold the physical goods. United States Oil (NYSEArca: USO), which owns oil futures contracts, is one example of such a fund. In fact, most commodity ETFs own futures – they’re less frequently physically-backed.
Five Energy MLPs to Consider for Income
A strong case can be made that master limited partnerships (MLPs) will outperform stocks over the next several years. Supposing that this is the case, I thought I would take a look at a few MLPs I believe are positioned to outperform.
MLPs have a different structure from most publicly traded companies. Instead of being structured as corporations, they are structured as limited partnerships. This has some big tax advantages, but can also create some tax filing complications. Be sure that you understand the MLP structure well before buying any units.
To be considered for inclusion in the following list, an MLP was required to be in the midstream business, have a debt/equity ratio below 200%, and have a current ratio above 1. From there I looked for a combination of low valuations, high profitability, high payout ratio adjusted distributions and distribution growth. Below are the five MLPs that I think best fit those criteria.
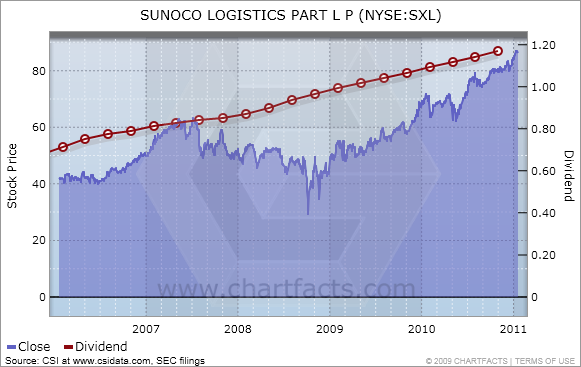
Sunoco Logistics Partners L.P. (SXL)
Sunoco Logistics transports and stores crude oil and refined petroleum products for customers in major activity centers in the Northeast, Midwest and Gulf Coast regions of the United States. The company also buys crude oil from U.S. domestic producers and sells it to refiners.
Dividend Yield: 5.47%
Payout Ratio: 48%
5 Yr Dividend Growth: 12.73%
Enterprise Value/Operating Cash Flow: 18.29
Total Debt to Equity: 140.76%
Current Ratio: 1.16
Return on Investment: 15.97%
Click to enlarge

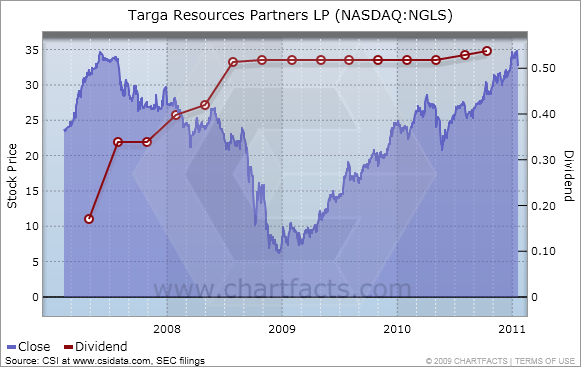
Targa Resources Partners LP (NGLS)
Targa Resources Partners is a Delaware limited partnership engaged in the business of gathering, compressing, treating, processing and selling natural gas and storing, fractionating, treating, transporting and selling natural gas liquids, or NGLs, and NGL products. The partnership owns an extensive network of integrated gathering pipelines and gas processing plants and currently operates along the Louisiana Gulf Coast, accessing the coastal and offshore region of Louisiana, the Permian Basin in West Texas and Southeast New Mexico and the Fort Worth Basin in North Texas. Additionally, the company's natural gas liquids logistics and marketing assets are located primarily at Mont Belvieu and Galena Park near Houston, Texas, and in Lake Charles, Louisiana, with terminals and transportation assets across the United States. Targa Resources Partners is managed by its general partner, Targa Resources GP LLC, which is indirectly wholly owned by Targa Resources Corp. (TRGP).
Dividend Yield: 6.37%
Payout Ratio: 176%
5 Yr Dividend Growth: N/A
Enterprise Value/Operating Cash Flow: N/A
Total Debt to Equity: 146.44%
Current Ratio: 1.13
Return on Investment: 6.04%
Click to enlarge

Enterprise Products Partners L.P. (EPD)
Enterprise Products Partners L.P. (Enterprise Products Partners) is a North American midstream energy company providing a range of services to producers and consumers of natural gas, natural gas liquids (NGLs), crude oil, refined products and certain petrochemicals. In addition, the company is engaged in the development of pipeline and other midstream energy infrastructure in the continental United States and Gulf of Mexico.
Dividend Yield: 5.5%
Payout Ratio: 109%
5 Yr Dividend Growth: 7.73%
Enterprise Value / Operating Cash Flow: 16.75
Total Debt to Equity: 123.25%
Current Ratio: 1.01
Return on Investment: 8.06%
Click to enlarge

Buckeye Partners, L.P. (BPL)
Buckeye Partners, L.P. is a publicly traded partnership that owns and operates one of the largest independent refined petroleum products pipeline systems in the United States in terms of volumes delivered, with approximately 5,400 miles of pipeline; owns 69 active refined petroleum products terminals; operates and maintains approximately 2,400 miles of pipeline under agreements with major oil and chemical companies; owns a major natural gas storage facility in northern California; and markets refined petroleum products in certain of the geographic areas served by its pipeline and terminal operations.
Dividend Yield: 5.78%
Payout Ratio: 101%
5 Yr Dividend Growth: 6.86%
Enterprise Value / Operating Cash Flow: 17.93
Total Debt to Equity: 144.97%
Current Ratio: 1.3
Return on Investment: 8.94%
Click to enlarge

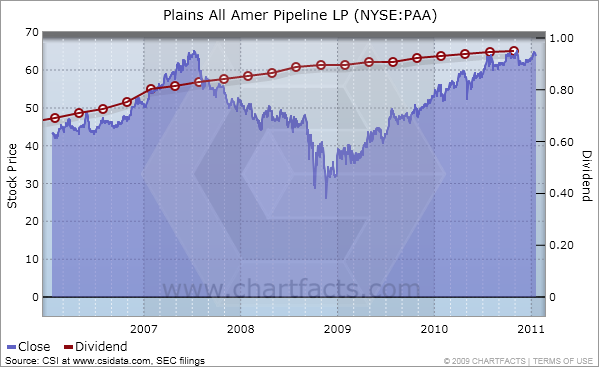
Plains All American Pipeline, L.P. (PAA)
Plains All American Pipeline, L.P. is a publicly traded master limited partnership (“MLP”) engaged in the transportation, storage, terminalling and marketing of crude oil, refined products and liquefied petroleum gas and other natural gas related petroleum products (together "LPG"). Through its general partner interest and majority equity ownership position in PAA Natural Gas Storage, L.P. (PNG), the company also is engaged in the development and operation of natural gas storage facilities.
Dividend Yield: 6.04%
Payout Ratio: 167%
5 Yr Dividend Growth: 9%
Enterprise Value / Operating Cash Flow: 29.24
Total Debt to Equity: 133.5%
Current Ratio: 1.06
Return on Investment: 5.46%
Click to enlarge

Disclosure: I have no positions in any stocks mentioned, and no plans to initiate any positions within the next 72 hours.
MLPs have a different structure from most publicly traded companies. Instead of being structured as corporations, they are structured as limited partnerships. This has some big tax advantages, but can also create some tax filing complications. Be sure that you understand the MLP structure well before buying any units.
To be considered for inclusion in the following list, an MLP was required to be in the midstream business, have a debt/equity ratio below 200%, and have a current ratio above 1. From there I looked for a combination of low valuations, high profitability, high payout ratio adjusted distributions and distribution growth. Below are the five MLPs that I think best fit those criteria.
Sunoco Logistics Partners L.P. (SXL)
Sunoco Logistics transports and stores crude oil and refined petroleum products for customers in major activity centers in the Northeast, Midwest and Gulf Coast regions of the United States. The company also buys crude oil from U.S. domestic producers and sells it to refiners.
Dividend Yield: 5.47%
Payout Ratio: 48%
5 Yr Dividend Growth: 12.73%
Enterprise Value/Operating Cash Flow: 18.29
Total Debt to Equity: 140.76%
Current Ratio: 1.16
Return on Investment: 15.97%
Click to enlarge
Targa Resources Partners LP (NGLS)
Targa Resources Partners is a Delaware limited partnership engaged in the business of gathering, compressing, treating, processing and selling natural gas and storing, fractionating, treating, transporting and selling natural gas liquids, or NGLs, and NGL products. The partnership owns an extensive network of integrated gathering pipelines and gas processing plants and currently operates along the Louisiana Gulf Coast, accessing the coastal and offshore region of Louisiana, the Permian Basin in West Texas and Southeast New Mexico and the Fort Worth Basin in North Texas. Additionally, the company's natural gas liquids logistics and marketing assets are located primarily at Mont Belvieu and Galena Park near Houston, Texas, and in Lake Charles, Louisiana, with terminals and transportation assets across the United States. Targa Resources Partners is managed by its general partner, Targa Resources GP LLC, which is indirectly wholly owned by Targa Resources Corp. (TRGP).
Dividend Yield: 6.37%
Payout Ratio: 176%
5 Yr Dividend Growth: N/A
Enterprise Value/Operating Cash Flow: N/A
Total Debt to Equity: 146.44%
Current Ratio: 1.13
Return on Investment: 6.04%
Click to enlarge
Enterprise Products Partners L.P. (EPD)
Enterprise Products Partners L.P. (Enterprise Products Partners) is a North American midstream energy company providing a range of services to producers and consumers of natural gas, natural gas liquids (NGLs), crude oil, refined products and certain petrochemicals. In addition, the company is engaged in the development of pipeline and other midstream energy infrastructure in the continental United States and Gulf of Mexico.
Dividend Yield: 5.5%
Payout Ratio: 109%
5 Yr Dividend Growth: 7.73%
Enterprise Value / Operating Cash Flow: 16.75
Total Debt to Equity: 123.25%
Current Ratio: 1.01
Return on Investment: 8.06%
Click to enlarge

Buckeye Partners, L.P. (BPL)
Buckeye Partners, L.P. is a publicly traded partnership that owns and operates one of the largest independent refined petroleum products pipeline systems in the United States in terms of volumes delivered, with approximately 5,400 miles of pipeline; owns 69 active refined petroleum products terminals; operates and maintains approximately 2,400 miles of pipeline under agreements with major oil and chemical companies; owns a major natural gas storage facility in northern California; and markets refined petroleum products in certain of the geographic areas served by its pipeline and terminal operations.
Dividend Yield: 5.78%
Payout Ratio: 101%
5 Yr Dividend Growth: 6.86%
Enterprise Value / Operating Cash Flow: 17.93
Total Debt to Equity: 144.97%
Current Ratio: 1.3
Return on Investment: 8.94%
Click to enlarge

Plains All American Pipeline, L.P. (PAA)
Plains All American Pipeline, L.P. is a publicly traded master limited partnership (“MLP”) engaged in the transportation, storage, terminalling and marketing of crude oil, refined products and liquefied petroleum gas and other natural gas related petroleum products (together "LPG"). Through its general partner interest and majority equity ownership position in PAA Natural Gas Storage, L.P. (PNG), the company also is engaged in the development and operation of natural gas storage facilities.
Dividend Yield: 6.04%
Payout Ratio: 167%
5 Yr Dividend Growth: 9%
Enterprise Value / Operating Cash Flow: 29.24
Total Debt to Equity: 133.5%
Current Ratio: 1.06
Return on Investment: 5.46%
Click to enlarge
Disclosure: I have no positions in any stocks mentioned, and no plans to initiate any positions within the next 72 hours.
ArcelorMittal And The Steel Catch-Up Trade (MT, VALE, AA, FCX, PKX)
The financial news often seems to talk about commodities as though they all trade together. The reality, though, is altogether different. While it is true that producers of copper, aluminum, and steel all depend to some extent on a healthy global economy, there can be a great deal of inconsistency between the individual commodities. So while iron giant Vale (Nasdaq: VALE) and aluminum king Alcoa (NYSE:AA) have done well over the past year, Freeport McMoRan (NYSE:FCX) has far surpassed them while ArcelorMittal (NYSE:MT) has been quite the laggard.
Maybe that begins to change in 2011, and maybe investors should freshen up their due diligence on the largest player in the steel business.
A Solid End to a Tough YearAlthough 2010 was hardly a disaster for ArcelorMittal or the steel industry as a whole, the memory of the boom years of 2007 and 2008 are still fresh in many people's minds. With certain commodities like copper hitting all-time highs recently, patience has been a little harder to come by in a steel sector still suffering from a sluggish economic recovery in North America and Western Europe.
Still, ArcelorMittal ended the year on a solid note. Revenue rose 19% from the year-ago level (and 5% sequentially) and topped $20 billion. EBITDA was down 14% from the third quarter, but still higher than the consensus expectation and this quarter's number was arguably cleaner (that is, there were fewer non-operating items influencing the number).
Shipments climbed 3% on a sequential basis, and the company produced 21.6 metric tons of steel in the period. That was enough to give the company a 69% utilization rate - a rate that is below the point where the company can really operate at top efficiency.
Looking Ahead
Fourth quarter results looked surprisingly good in Europe on a revenue basis (profitability was not so strong), and the performance in the U.S. was OK as well. That said, the company did guide to a stronger first quarter and a utilization rate of around 76%.
The real question that investors in ArcelorMittal, POSCO (NYSE:PKX), Nucor (NYSE:NUE) and Steel Dynamics (Nasdaq:STLD) care about, though, is whether this recovery can continue. For now the answer would seem to be "yes." Construction has not recovered yet in the Western economies, but continues apace in places like China, Brazil and India. Moreover, a lot of steel goes into the heavy-duty equipment produced by the likes of Caterpillar (NYSE:CAT) and Deere (NYSE:DE) and those businesses are seeing very strong revenue and ordering patterns right now.
The Bottom Line
ArcelorMittal probably does not get all of the credit it is due. Sure, it is "just a steel company," but it is one with a rather remarkable track record of maintaining positive free cash flow and solid free cash flow margins. What's more, the company has led the way in vertical integration and supplies a large percentage of its internal needs for both coal and iron ore - leaving it less exposed to the pricing power of Vale, Teck (NYSE:TCK), BHP Billiton (NYSE:BHP) and so on.
What's more, investors do not always seem to appreciate that there will always be a need for companies like ArcelorMittal. Mini-mills are efficient and have a valuable role to play, but the quality of their steel is not the same and cannot necessarily be used in all of the same applications (though many mini-mill operators like Nucor will add certain components into the mix to improve the quality).
Analysts do not seem completely sold on the strength or sustainability of a recovery in steel, and investors may still be able to find a bargain here. Clearly a global slowdown would be bad news for the sector, as would out-of-control production increases in China (which has happened before). All of that said, ArcelorMittal is a stock that looks like it should be trading closer to the high $40s than the high $30s.
Disclosure I am long CAT, DE and FCX shares.
Maybe that begins to change in 2011, and maybe investors should freshen up their due diligence on the largest player in the steel business.
A Solid End to a Tough YearAlthough 2010 was hardly a disaster for ArcelorMittal or the steel industry as a whole, the memory of the boom years of 2007 and 2008 are still fresh in many people's minds. With certain commodities like copper hitting all-time highs recently, patience has been a little harder to come by in a steel sector still suffering from a sluggish economic recovery in North America and Western Europe.
Still, ArcelorMittal ended the year on a solid note. Revenue rose 19% from the year-ago level (and 5% sequentially) and topped $20 billion. EBITDA was down 14% from the third quarter, but still higher than the consensus expectation and this quarter's number was arguably cleaner (that is, there were fewer non-operating items influencing the number).
Shipments climbed 3% on a sequential basis, and the company produced 21.6 metric tons of steel in the period. That was enough to give the company a 69% utilization rate - a rate that is below the point where the company can really operate at top efficiency.
Looking Ahead
Fourth quarter results looked surprisingly good in Europe on a revenue basis (profitability was not so strong), and the performance in the U.S. was OK as well. That said, the company did guide to a stronger first quarter and a utilization rate of around 76%.
The real question that investors in ArcelorMittal, POSCO (NYSE:PKX), Nucor (NYSE:NUE) and Steel Dynamics (Nasdaq:STLD) care about, though, is whether this recovery can continue. For now the answer would seem to be "yes." Construction has not recovered yet in the Western economies, but continues apace in places like China, Brazil and India. Moreover, a lot of steel goes into the heavy-duty equipment produced by the likes of Caterpillar (NYSE:CAT) and Deere (NYSE:DE) and those businesses are seeing very strong revenue and ordering patterns right now.
The Bottom Line
ArcelorMittal probably does not get all of the credit it is due. Sure, it is "just a steel company," but it is one with a rather remarkable track record of maintaining positive free cash flow and solid free cash flow margins. What's more, the company has led the way in vertical integration and supplies a large percentage of its internal needs for both coal and iron ore - leaving it less exposed to the pricing power of Vale, Teck (NYSE:TCK), BHP Billiton (NYSE:BHP) and so on.
What's more, investors do not always seem to appreciate that there will always be a need for companies like ArcelorMittal. Mini-mills are efficient and have a valuable role to play, but the quality of their steel is not the same and cannot necessarily be used in all of the same applications (though many mini-mill operators like Nucor will add certain components into the mix to improve the quality).
Analysts do not seem completely sold on the strength or sustainability of a recovery in steel, and investors may still be able to find a bargain here. Clearly a global slowdown would be bad news for the sector, as would out-of-control production increases in China (which has happened before). All of that said, ArcelorMittal is a stock that looks like it should be trading closer to the high $40s than the high $30s.
Disclosure I am long CAT, DE and FCX shares.
Dividend Yield, Growth, Safety and a Low Valuation................Need I say More
Chevron Corp. (CVX) is the second largest integrated energy company in the United States, and the world's fourth-largest oil company based on proven reserves. Yet in spite of its immense size, I believe this top quality company has plenty of opportunity to grow worldwide.
Chevron's balance sheet is strong and their cash balances exceeded their debt by over $5.6 billion at the end of 2010. Additionally, we are confident that their strong cash flow generation will allow them to continue to repurchase shares, aggressively invest in their future and continue to grow their dividend as they have for the past 23 years.
I believe that Chevron’s stock is undervalued with a PE ratio of just over ten times earnings, a debt to equity ratio of 10% and the dividend yield of 3%. Over the last decade, since the recession of 2001, Chevron has grown earnings per share by 8.8% per annum.
In contrast, the S&P 500, representing the average company, has only grown earnings at 4.9% per annum. Nevertheless, the current PE ratio of the S&P 500 is 15.6, which is approximately 50% higher than Chevron's PE of 10. Chevron has almost twice the growth rate, almost twice the dividend yield, a debt to equity ratio of 10 versus the S&P 500's 49, and yet ludicrously trades at a discount valuation to the index.
Disclosure I am Long CVX shares.
Chevron's balance sheet is strong and their cash balances exceeded their debt by over $5.6 billion at the end of 2010. Additionally, we are confident that their strong cash flow generation will allow them to continue to repurchase shares, aggressively invest in their future and continue to grow their dividend as they have for the past 23 years.
I believe that Chevron’s stock is undervalued with a PE ratio of just over ten times earnings, a debt to equity ratio of 10% and the dividend yield of 3%. Over the last decade, since the recession of 2001, Chevron has grown earnings per share by 8.8% per annum.
In contrast, the S&P 500, representing the average company, has only grown earnings at 4.9% per annum. Nevertheless, the current PE ratio of the S&P 500 is 15.6, which is approximately 50% higher than Chevron's PE of 10. Chevron has almost twice the growth rate, almost twice the dividend yield, a debt to equity ratio of 10 versus the S&P 500's 49, and yet ludicrously trades at a discount valuation to the index.
Disclosure I am Long CVX shares.
A Cheaper Dollar Will Open The Door For These Chinese Investments (UUP, MUB, TCK, CCJ, GMO, PWR)
On January 18th and 19th, the top officials of the two most powerful nations on Earth are to meet in matters of far reaching significance. There will be not one but two dinners. One is to be a grand dinner of state with all of the military and business leaders of both sides in attendance. The other is to be an “intimate” dinner. Oh, to be a fly on the wall of that private meeting.
Behind the photo-ops and the speeches there is one basic reality, China and America are joined inseparably at the hip in a single entity, which I am calling “The Chinamese Twins.” As in all such pairings each head can have their own separate and distinct personalities. The fact remains you can call one capitalism and the other communism, but both heads are mutually dependent on a single life support system. The world financial network provides circulatory nourishment to both heads whose interests are complementary.
Washington needs the cheap dollar (NYSE:UUP) to pay off colossal debts. China needs to revalue its Yuan to counter domestic inflation in such areas as food and basic consumer goods. The Chinese have raised interest rates and bank reserve rules, to little avail. At the same time the Chinese do not want to dry up credit which would impede their growing economy or slowdown exports.
A current headline in the Wall St. Journal reads, “The Bank Of China Moves to Make Yuan a Global Currency.” This will come as no surprise to goldstocktrades.com readers. In an article I wrote back in November, I spoke about China and Russia beginning to trade in Yuan and Rubles causing the need for the Yuan to be revalued higher.
The Chinese economy is thriving and they can well afford to revalue the Yuan higher. This stronger yuan will make North American resource assets cheaper and put China in the driver’s seat to control many of the large undeveloped assets. At the same time they are buying gold, silver and uranium assets hand over fist to hedge themselves from a U.S. dollar decline, in which they own the largest interest. In 2009 the Chinese Investment Corporation, a state owned company, took large ownership positions in Teck Cominco (NYSE:TCK) and Penn West Energy Trust (NYSE:PWR). Recently in June, China National Nuclear signed a contract with Cameco (NYSE:CCJ) to supply 23 million pounds of uranium. Hanlong Investments took a large stake in General Moly (AMEX:GMO), one of the leading North American molybdenum developers.
They want more gold and silver to support the Yuan in order to ensure that when the Yuan becomes the major world currency, it will be more resistant to the swings encountered by fiat currencies. Additionally, they also want more precious metals to buttress its fiscal balance sheet and what they feel is the eventual replacement of the U.S. Dollar as the world’s reserve currency. They are also rapidly developing and modernizing increasing their use of uranium, potash, molybdenum, rare earths, coal and oil and gas.
By revaluing the Yuan higher, China will be able to control inflation and rising costs. A higher Yuan will also benefit the Chinese investment side which has already been active making deals in North America. The U.S. dollar will significantly be cheaper for the Chinese which would allow them to acquire North American assets for pennies on the dollar. Just recently the Chinese Investment Corporation, whose focus is to look for investment opportunities abroad opened its first international branch in Toronto, which is the North American epicenter of resource companies. Its one billion plus people can enjoy more purchasing power through a higher yuan and a higher standard of living with a supply of North American natural resources which could fuel their rapid development.
Beyond the blustering and posturing at these dinners the trade off is that they want carte blanche to enter more strongly into the heart of capitalism and the North American resource sector. Here the Chinese can get all the gold, silver and natural resource deals they want. Doors will quietly swing open and everyone will go home happy. The Chinese will have their desired access to buy gold and natural resource stocks, while The Americans receive a weaker dollar with which to pay off their burgeoning debts. If you are thinking that such a Byzantine arrangement can’t be done, be assured it has all happened before. During the 1980’s the USSR sold large amounts of gold secretly in New York. It took three years to become public knowledge.
Another part of this “Chinamese” agreement concerns rare metals, on which the Chinese head wants to maintain its strategic grip of over 95% of the world’s supply. I feel the U.S. will not make this an issue. The U.S. will accommodate China in order to persuade them to raise the Yuan higher and the dollar lower. I feel this revaluation will be done in a series of two or three steps in 2011, which should eventually move precious metals into new high territories and crush the U.S. dollar. Volatile sell offs in gold and silver like I predicted in November and December, which we are currently experiencing now, may present long term precious metal investors with buying opportunities.
Underneath all of the media hype and adversarial stories between China and America, I read a front page story in the New York Times of 1-17-11, “GE To Share Jet Technology With China In A New Joint Venture.” Expect to hear more deals in 2011 in which the Chinese continue to invest in natural resource assets in North America, while the U.S. continues to search for a way out of the financial crisis.
We may see further bailouts from the federal government as many states are in danger of defaulting. The bankrupt states are already asking Washington for assistance. This devaluation of the dollar that Geithner and Obama are asking for is to help the US pay off its debts and be able to raise its debt ceiling with cheap devalued dollars. This should be bullish for precious metal prices where investors will seek shelter from soaring government deficits and a loss of the U.S. dollar as the world reserve currency. See the iShares S&P National AMT-Free Muni Bond ETF (NYSE:MUB) chart below:
 Disclosure None
Behind the photo-ops and the speeches there is one basic reality, China and America are joined inseparably at the hip in a single entity, which I am calling “The Chinamese Twins.” As in all such pairings each head can have their own separate and distinct personalities. The fact remains you can call one capitalism and the other communism, but both heads are mutually dependent on a single life support system. The world financial network provides circulatory nourishment to both heads whose interests are complementary.
Washington needs the cheap dollar (NYSE:UUP) to pay off colossal debts. China needs to revalue its Yuan to counter domestic inflation in such areas as food and basic consumer goods. The Chinese have raised interest rates and bank reserve rules, to little avail. At the same time the Chinese do not want to dry up credit which would impede their growing economy or slowdown exports.
A current headline in the Wall St. Journal reads, “The Bank Of China Moves to Make Yuan a Global Currency.” This will come as no surprise to goldstocktrades.com readers. In an article I wrote back in November, I spoke about China and Russia beginning to trade in Yuan and Rubles causing the need for the Yuan to be revalued higher.
The Chinese economy is thriving and they can well afford to revalue the Yuan higher. This stronger yuan will make North American resource assets cheaper and put China in the driver’s seat to control many of the large undeveloped assets. At the same time they are buying gold, silver and uranium assets hand over fist to hedge themselves from a U.S. dollar decline, in which they own the largest interest. In 2009 the Chinese Investment Corporation, a state owned company, took large ownership positions in Teck Cominco (NYSE:TCK) and Penn West Energy Trust (NYSE:PWR). Recently in June, China National Nuclear signed a contract with Cameco (NYSE:CCJ) to supply 23 million pounds of uranium. Hanlong Investments took a large stake in General Moly (AMEX:GMO), one of the leading North American molybdenum developers.
They want more gold and silver to support the Yuan in order to ensure that when the Yuan becomes the major world currency, it will be more resistant to the swings encountered by fiat currencies. Additionally, they also want more precious metals to buttress its fiscal balance sheet and what they feel is the eventual replacement of the U.S. Dollar as the world’s reserve currency. They are also rapidly developing and modernizing increasing their use of uranium, potash, molybdenum, rare earths, coal and oil and gas.
By revaluing the Yuan higher, China will be able to control inflation and rising costs. A higher Yuan will also benefit the Chinese investment side which has already been active making deals in North America. The U.S. dollar will significantly be cheaper for the Chinese which would allow them to acquire North American assets for pennies on the dollar. Just recently the Chinese Investment Corporation, whose focus is to look for investment opportunities abroad opened its first international branch in Toronto, which is the North American epicenter of resource companies. Its one billion plus people can enjoy more purchasing power through a higher yuan and a higher standard of living with a supply of North American natural resources which could fuel their rapid development.
Beyond the blustering and posturing at these dinners the trade off is that they want carte blanche to enter more strongly into the heart of capitalism and the North American resource sector. Here the Chinese can get all the gold, silver and natural resource deals they want. Doors will quietly swing open and everyone will go home happy. The Chinese will have their desired access to buy gold and natural resource stocks, while The Americans receive a weaker dollar with which to pay off their burgeoning debts. If you are thinking that such a Byzantine arrangement can’t be done, be assured it has all happened before. During the 1980’s the USSR sold large amounts of gold secretly in New York. It took three years to become public knowledge.
Another part of this “Chinamese” agreement concerns rare metals, on which the Chinese head wants to maintain its strategic grip of over 95% of the world’s supply. I feel the U.S. will not make this an issue. The U.S. will accommodate China in order to persuade them to raise the Yuan higher and the dollar lower. I feel this revaluation will be done in a series of two or three steps in 2011, which should eventually move precious metals into new high territories and crush the U.S. dollar. Volatile sell offs in gold and silver like I predicted in November and December, which we are currently experiencing now, may present long term precious metal investors with buying opportunities.
Underneath all of the media hype and adversarial stories between China and America, I read a front page story in the New York Times of 1-17-11, “GE To Share Jet Technology With China In A New Joint Venture.” Expect to hear more deals in 2011 in which the Chinese continue to invest in natural resource assets in North America, while the U.S. continues to search for a way out of the financial crisis.
We may see further bailouts from the federal government as many states are in danger of defaulting. The bankrupt states are already asking Washington for assistance. This devaluation of the dollar that Geithner and Obama are asking for is to help the US pay off its debts and be able to raise its debt ceiling with cheap devalued dollars. This should be bullish for precious metal prices where investors will seek shelter from soaring government deficits and a loss of the U.S. dollar as the world reserve currency. See the iShares S&P National AMT-Free Muni Bond ETF (NYSE:MUB) chart below:
Disclosure None
Wednesday, February 16, 2011
Nucor (NUE) Declares $0.3625 Quarterly Dividend
Nucor Corporation (NYSE: NUE) declared the regular quarterly cash dividend of $0.3625 per share on Nucor's common stock, $1.45 annualized.
This cash dividend is payable on May 11, 2011 to stockholders of record on March 31, 2011. The ex-dividend date is March 29, 2011.
Yield on the dividend is 3%.
Disclosure I am long NUE shares.
This cash dividend is payable on May 11, 2011 to stockholders of record on March 31, 2011. The ex-dividend date is March 29, 2011.
Yield on the dividend is 3%.
Disclosure I am long NUE shares.
Monday, February 14, 2011
Friedman Industries, FRD Incorporated Announces Third Quarter Results
Friedman Industries, Incorporated (NYSE Amex: FRD), a Texas-based company engaged in pipe manufacturing, steel coil processing and steel and pipe distribution, announced today its results of operations for the third quarter. For the quarter ended December 31, 2010, the Company recorded net earnings of $1,733,494 ($0.25 per share diluted) on sales of $31,135,887. During the quarter ended December 31, 2009, the Company recorded a net loss of $41,239 ($0.01 loss per share diluted) on sales of $13,470,721.
Disclosure I am Long FRD Shares.
Disclosure I am Long FRD Shares.
| SUMMARY OF OPERATIONS (unaudited) | ||||||||||||||||||
| THREE MONTHS ENDED DEC. 31, | NINE MONTHS ENDED DEC. 31, | |||||||||||||||||
| 2010 | 2009 | 2010 | 2009 | |||||||||||||||
| Net sales | $ | 31,135,887 | $ | 13,470,721 | $ | 89,711,381 | $ | 41,803,270 | ||||||||||
| Total costs, and other income | 28,510,988 | 13,443,389 | 82,271,525 | 42,382,602 | ||||||||||||||
| Earnings (loss) before income taxes | 2,624,899 | 27,332 | 7,439,856 | (579,332 | ) | |||||||||||||
| Income taxes | 891,405 | 68,571 | 2,486,794 | (169,098 | ) | |||||||||||||
| Net earnings (loss) | $ | 1,733,494 | $ | (41,239 | ) | $ | 4,953,062 | $ | (410,234 | ) | ||||||||
| Weighted average shares outstanding: | ||||||||||||||||||
| Basic | 6,799,444 | 6,799,444 | 6,799,444 | 6,799,444 | ||||||||||||||
| Diluted | 6,799,444 | 6,799,444 | 6,799,444 | 6,799,444 | ||||||||||||||
| Earnings (loss) per share: | ||||||||||||||||||
| Basic | $ | 0.25 | $ | (0.01 | ) | $ | 0.73 | $ | (0.06 | ) | ||||||||
| Diluted | $ | 0.25 | $ | (0.01 | ) | $ | 0.73 | $ | (0.06 | ) | ||||||||
Commodity ETFs Get No Love From Investors (GLD, IAU, SGOL, SLV, SIVR, PPLT, PALL, BAL, USO, USCI, CORN, WOOD, COPX)
It doesn’t seem like that long ago that exchange-traded commodity products were the darlings of the ETF world. Praised for democratizing an entire asset class (and one capable of delivering non-correlated returns to investors at that), commodity ETFs saw billions of dollars of cash inflows in 2009. Investors rushed to get their hands on everything from copper to tin, and they embraced the transparency and liquidity that the exchange-traded structure had to offer.
Last year was a banner year for commodities, with inflationary pressures, surging demand from emerging markets, and a host of supply issues conspiring to push prices of various resources sharply higher. Corn prices surged, gold repeatedly set new record highs, and a host of other agricultural products–including sugar and soybeans–climbed sharply higher. While 2010 was a stellar year all around for investors–most major asset classes posted nice gains–commodities were clearly the star. Lists of the year’s best performing ETFs included numerous commodity products, and gains of 50% were relatively common.
Considering the white hot performances turned in, 2010 should have been another great year for commodity ETFs–especially given investors’ tendency to chase returns. And a cursory look does indeed show continued strong interest in commodity ETFs; according to data from the National Stock Exchange, long unleveraged commodity products took in close to $11 billion in inflows. But there is more (or actually, less) to that number than meets the eye. Almost all of cash inflows into commodity ETPs in 2010 were attributable to physically-backed precious metals funds:
According to the ETF Screener, there are 74 non-leveraged, non-inverse commodity ETPs. Stripping out the seven physically-backed precious metals products SPDR Gold Shares (NYSE:GLD), iShares Gold Trust (NYSE:IAU), ETFS Physical Swiss Gold Shares (NYSE:SGOL), iShares Silver Trust (NYSE:SLV), ETFS Physical Silver Shares (NYSE:SIVR), ETFS Physical Platinum Shares (NYSE:PPLT), and ETFS Physical Palladium Shares (NYSE:PALL), this group took in only about $250 million last year. January inflows showed a decent bounce back, but the lack of interest still seems a bit strange. Precious metals have obviously been on quite a hot streak, so it shouldn’t be a total surprise that assets have been flowing into these funds at a torrid pace. But gold and silver aren’t the only commodities that have posted eye-popping gains over the last year–yet they account for the lions share of inflows. The iPath Cotton ETN (NYSE:BAL) jumped more than 95% in 2010, yet took in just $17 million of new assets.
War On Contango
It seems likely that the lack of interest in certain commodity ETFs has something to do with the manner in which exposure is achieved–and perhaps not necessarily the underlying resource. The seven precious metals products highlighted above are all physically-backed, meaning that the underlying assets are physical commodities. The majority of commodity ETFs don’t invest directly in natural resources, but rather in futures contracts written on those commodities. And as investors have learned, the returns generated by a futures-based fund can be impacted not only by changes in the spot price of the underlying asset, but by the slope of the futures curve. While futures-based funds often exhibit near-perfect correlation to the spot commodity prices, there can be a significant difference between the return delivered by a futures strategy relative to a hypothetical return on spot prices. For example, the United States Oil Fund (NYSE:USO), which invests in futures contracts on light, sweet crude oil, has lagged behind a hypothetical return on spot crude oil over the last several years:

The potentially adverse impact of contango in the returns of commodity ETFs has been well documented, and it appears that the nuances of futures-based investment strategies have had a material impact on investors interest in commodity products. Exposure to spot commodity prices remains desirable, but that simply isn’t possible for many resources. The high value-to-weight ratio of gold and silver makes construction of a physically-backed fund relatively straightforward. Funds that hold barrels full of crude oil or bushels of wheat would be impossible for logistical reasons, while the costs incurred in offering physically-backed exposure to other commodities would be a deterrent as well.
But that doesn’t mean that there aren’t ways to address the issue of contango in commodity products. It is perhaps no coincidence that two of the most successful commodity products to hit the market recently were designed to tackle the contango issue. The United States Commodity Index Fund (NYSE:USCI) screens 27 potential component commodity futures based on observable price signals, including a filter to select those least likely to be impacted adversely by contango. USCI raked in more than $90 million last year (it debuted in August) and had blown away other broad-based commodity funds from a performance perspective
Another popular commodity ETF has been the Teucrium Corn Fund (NYSE:CORN), a resource-specific product designed to reduce the effects of contango and backwardation. Unlike many commodity ETFs, CORN spreads exposure across multiple maturities, allocating 35% to the second-to-expire CBOT Corn Futures Contract, 30% to the third-to-expire CBOT Corn Futures Contract, and 35% to the CBOT Corn Futures Contract expiring in the December following the expiration month of the third- to-expire contract. That results in a smaller “roll yield” that can potentially deliver returns that correspond more closely to a hypothetical investment in spot corn prices. CORN took in $35 million last year, and that success has prompted Teucrium to roll out a natural gas ETF (NAGS) that approaches exposure in a similar manner. The company also has plans for a crude oil ETF (CRUD) that should begin trading within the next month.
Multiple issuers have filed for approval of physically-backed copper ETFs, and ETF Securities has already introduced three physical metal funds (copper, tin, and nickel) on the London Stock Exchange.
Betting On Commodities–Through Stocks
Another explanation for the tepid interest in commodity ETFs may be the surge in popularity of funds focusing on commodity intensive equities. Because the profitability of companies engaged in the extraction and sale of natural resources depends on the prevailing market price, mining stocks and other companies engaged in various aspects of commodity production can provide a contango-free option for establishing exposure to natural resource prices. The 25 products in the Commodity Producers Equities ETFdb Category took in $2.5 billion in aggregate last year. While funds focusing on gold and silver miners were among the most popular, broad-based funds such as HAP and other sector-specific options such as iShares S&P Global Timber & Forestry Idx (NYSE:WOOD) (timber) and Global X Copper Miners ETF (NYSE:COPX) (copper miners) also attracted significant dollar amounts
.
Innovation Continues
Since the first generation of commodity products burst on to the scene, investors have seemingly become more critical of the manner in which exposure to natural resources in offered. Contango has become a four-letter word to those who have been burned by an upward sloping futures curve, and interest in products that offer exposure through futures contracts has waned considerably. As recent product launches and the growing pipeline show, issuers are constructing the “next generation” of commodity ETFs to avoid the issues that have plagued the current lineup. Here’s to continued innovation in the commodity ETF space, leading to better options for accessing a very attractive asset class.
Disclosure I am IAU and SLV shares. As Well as the CFD closed end fund.
Last year was a banner year for commodities, with inflationary pressures, surging demand from emerging markets, and a host of supply issues conspiring to push prices of various resources sharply higher. Corn prices surged, gold repeatedly set new record highs, and a host of other agricultural products–including sugar and soybeans–climbed sharply higher. While 2010 was a stellar year all around for investors–most major asset classes posted nice gains–commodities were clearly the star. Lists of the year’s best performing ETFs included numerous commodity products, and gains of 50% were relatively common.
Considering the white hot performances turned in, 2010 should have been another great year for commodity ETFs–especially given investors’ tendency to chase returns. And a cursory look does indeed show continued strong interest in commodity ETFs; according to data from the National Stock Exchange, long unleveraged commodity products took in close to $11 billion in inflows. But there is more (or actually, less) to that number than meets the eye. Almost all of cash inflows into commodity ETPs in 2010 were attributable to physically-backed precious metals funds:
| Category | Inflows | |||
|---|---|---|---|---|
| Physical Gold ETFs | $8,064 | |||
| Physical Silver ETFs | $1,389 | |||
| Physical Platinum ETF | $689 | |||
| Physical Palladium ETF | $599 | |||
| All Other Commodity ETPs | $251 | |||
| Total 2010 Inflows | $10,992 | |||
| Source: NSX.com |
According to the ETF Screener, there are 74 non-leveraged, non-inverse commodity ETPs. Stripping out the seven physically-backed precious metals products SPDR Gold Shares (NYSE:GLD), iShares Gold Trust (NYSE:IAU), ETFS Physical Swiss Gold Shares (NYSE:SGOL), iShares Silver Trust (NYSE:SLV), ETFS Physical Silver Shares (NYSE:SIVR), ETFS Physical Platinum Shares (NYSE:PPLT), and ETFS Physical Palladium Shares (NYSE:PALL), this group took in only about $250 million last year. January inflows showed a decent bounce back, but the lack of interest still seems a bit strange. Precious metals have obviously been on quite a hot streak, so it shouldn’t be a total surprise that assets have been flowing into these funds at a torrid pace. But gold and silver aren’t the only commodities that have posted eye-popping gains over the last year–yet they account for the lions share of inflows. The iPath Cotton ETN (NYSE:BAL) jumped more than 95% in 2010, yet took in just $17 million of new assets.
War On Contango
It seems likely that the lack of interest in certain commodity ETFs has something to do with the manner in which exposure is achieved–and perhaps not necessarily the underlying resource. The seven precious metals products highlighted above are all physically-backed, meaning that the underlying assets are physical commodities. The majority of commodity ETFs don’t invest directly in natural resources, but rather in futures contracts written on those commodities. And as investors have learned, the returns generated by a futures-based fund can be impacted not only by changes in the spot price of the underlying asset, but by the slope of the futures curve. While futures-based funds often exhibit near-perfect correlation to the spot commodity prices, there can be a significant difference between the return delivered by a futures strategy relative to a hypothetical return on spot prices. For example, the United States Oil Fund (NYSE:USO), which invests in futures contracts on light, sweet crude oil, has lagged behind a hypothetical return on spot crude oil over the last several years:
The potentially adverse impact of contango in the returns of commodity ETFs has been well documented, and it appears that the nuances of futures-based investment strategies have had a material impact on investors interest in commodity products. Exposure to spot commodity prices remains desirable, but that simply isn’t possible for many resources. The high value-to-weight ratio of gold and silver makes construction of a physically-backed fund relatively straightforward. Funds that hold barrels full of crude oil or bushels of wheat would be impossible for logistical reasons, while the costs incurred in offering physically-backed exposure to other commodities would be a deterrent as well.
But that doesn’t mean that there aren’t ways to address the issue of contango in commodity products. It is perhaps no coincidence that two of the most successful commodity products to hit the market recently were designed to tackle the contango issue. The United States Commodity Index Fund (NYSE:USCI) screens 27 potential component commodity futures based on observable price signals, including a filter to select those least likely to be impacted adversely by contango. USCI raked in more than $90 million last year (it debuted in August) and had blown away other broad-based commodity funds from a performance perspective
Another popular commodity ETF has been the Teucrium Corn Fund (NYSE:CORN), a resource-specific product designed to reduce the effects of contango and backwardation. Unlike many commodity ETFs, CORN spreads exposure across multiple maturities, allocating 35% to the second-to-expire CBOT Corn Futures Contract, 30% to the third-to-expire CBOT Corn Futures Contract, and 35% to the CBOT Corn Futures Contract expiring in the December following the expiration month of the third- to-expire contract. That results in a smaller “roll yield” that can potentially deliver returns that correspond more closely to a hypothetical investment in spot corn prices. CORN took in $35 million last year, and that success has prompted Teucrium to roll out a natural gas ETF (NAGS) that approaches exposure in a similar manner. The company also has plans for a crude oil ETF (CRUD) that should begin trading within the next month.
Multiple issuers have filed for approval of physically-backed copper ETFs, and ETF Securities has already introduced three physical metal funds (copper, tin, and nickel) on the London Stock Exchange.
Betting On Commodities–Through Stocks
Another explanation for the tepid interest in commodity ETFs may be the surge in popularity of funds focusing on commodity intensive equities. Because the profitability of companies engaged in the extraction and sale of natural resources depends on the prevailing market price, mining stocks and other companies engaged in various aspects of commodity production can provide a contango-free option for establishing exposure to natural resource prices. The 25 products in the Commodity Producers Equities ETFdb Category took in $2.5 billion in aggregate last year. While funds focusing on gold and silver miners were among the most popular, broad-based funds such as HAP and other sector-specific options such as iShares S&P Global Timber & Forestry Idx (NYSE:WOOD) (timber) and Global X Copper Miners ETF (NYSE:COPX) (copper miners) also attracted significant dollar amounts
.
Innovation Continues
Since the first generation of commodity products burst on to the scene, investors have seemingly become more critical of the manner in which exposure to natural resources in offered. Contango has become a four-letter word to those who have been burned by an upward sloping futures curve, and interest in products that offer exposure through futures contracts has waned considerably. As recent product launches and the growing pipeline show, issuers are constructing the “next generation” of commodity ETFs to avoid the issues that have plagued the current lineup. Here’s to continued innovation in the commodity ETF space, leading to better options for accessing a very attractive asset class.
Disclosure I am IAU and SLV shares. As Well as the CFD closed end fund.
Nordic American Tanker Announces Dividend for the 54th Consecutive Quarter Since the Autumn of 1997
Link to the complete 4Q10 dividend report:
http://hugin.info/201/R/1488489/423906.pdf
Nordic American Tanker Shipping Ltd. ("NAT" or "the Company") announced today that the Company has declared a dividend of $0.25 per share for 4Q10, the same dividend as for 4Q09. The dividend policy will continue. The Company has a very strong balance sheet and we shall protect this position.
The Company will pay the dividend of $0.25 per share on or about March 4, 2011 to shareholders of record as of February 24, 2011. After the first three vessels were delivered in the autumn 1997, NAT has always paid a quarterly dividend; including the dividend for 4Q10 the total dividend payment amounts to $41.84 per share.
Including two newbuildings there are now 19 vessels in our fleet of which 15 vessels were trading during 4Q10. At the end of 2011 we expect to have a minimum of 19 vessels trading, representing a substantial increase in earnings and dividend capacity as vessels are being phased in during 2011. The Company remains committed to its strategy of dividend accretive growth and a strong balance sheet. This financial position of NAT is particularly important in a soft market when some tanker companies are experiencing financial difficulties.
Going forward the Company will continue to focus on accretive growth through acquisitions and on keeping the average age of the fleet low. The Company is pursuing a disciplined investment policy. We encourage investors wishing to receive dividends and to have exposure to the tanker sector to assess our model and invest in our Company.
The key points:
The Company will continue to keep a strong balance sheet with no or little net debt.
The Company is also in a good position to take advantage of strong shipping markets, which will translate into increased dividend payouts. When the market is down we do not "cut" the dividend, we adjust it, depending upon the general spot market freight level for suezmax tankers.
Below is a chart indicating the annual dividend capacity based on a fleet of 20 vessels and 24 vessels at different spot market rates and today's sharecount.
Link to the graph: http://hugin.info/201/R/1488489/423906.pdf
The above is based on 355 income days per vessel per year. The net debt will be about $7m per vessel with a cash break-even level of $11,300 per day per vessel for a 20 vessel fleet. The graph shows the substantial dividend capacity of NAT.
We see that prices for second hand vessels have softened. Should this development continue, we shall be in a position to acquire further vessels inexpensively compared to historical levels. Such acquisitions would increase the dividend capacity of the Company. It is a prerequisite for any expansion of the fleet that the dividend and earnings capacity per share will increase.
When the freight market is above the cash break-even level, the Company can be expected to pay a dividend. The breakeven rate is the amount of average daily revenues our vessels would need to earn in the spot market in order to cover our vessel operating expenses, voyage expenses, if any, cash general and administrative expenses, interest expense and other financial charges.
The annual spot rates as reported by R.S. Platou Economic Research a.s. show that during the last 11 years up to the end of 2010, 7 years have produced about $40,000 on average per day per vessel or more. This is reflected in the graph later in this report.
The tightened terms of commercial bank financing and higher margins on shipping loans are challenging for debt-laden shipping companies. By having no or little net debt, NAT is better positioned to navigate the financial seas, as we believe this is in the best interests of our shareholders.
Our primary objective is to maximize total return[1] to our shareholders, including maximizing our quarterly cash dividend.
The Company has further acquisitions under evaluation and will work to continue to strengthen its position compared with that of its competitors.
Financial Information
The Board has declared a dividend of $0.25 per share in respect of 4Q10 to shareholders of record as of February 24, 2011 compared with $0.25 per share for 4Q09 and $0.25 share for 3Q10. The average number of shares outstanding for the fourth quarter of 2010 was 46,898,782 -- the same as at the end of 3Q10. The market capitalization of the Company stood at $1.2 billion as of February 11, 2011. It is important to have a sizable market capitalization in order to provide for good liquidity in the share.
The Company's operating cash flow[2] was $5.2m for 4Q10, compared to $10.5m for 4Q09.
We consider our general and administrative costs per day per vessel to be at a low level. We also continue to concentrate on keeping our vessel operating costs low, while always maintaining our commitment to safe vessel operations. We in particular focus on cost synergies of operating a homogenous fleet.
At the time of this report, the Company has no net debt and has a revolving credit facility of $500m of which $75m has been drawn. The credit facility, which matures in September 2013, is not subject to reduction by the lenders and there is no obligation to repay principal during the term of the facility. The Company pays interest only on drawn amounts and a commitment fee for undrawn amounts.
Several publicly traded tanker companies have significant debt, which could make it difficult for them to buy vessels in a weak market.
The table below gives the annual dividend payments as well as quarterly dividend payments for the past 13 years -- the dividends are essentially based on earnings and operating cashflow in the preceeding quarter.
Link to the graph: http://hugin.info/201/R/1488489/423906.pdf
As reported earlier, the Company did not take delivery of a newbuilding (Nordic Galaxy) in August 2010 as it was not in a deliverable condition. This vessel will not join our fleet. We have debited the profit & loss account by a one-time charge of $1.5m related to direct costs of this newbuilding. We will claim this amount from the seller of the vessel as one component in the arbitration process. The parent company (First Olsen Ltd.) of the seller has not repaid an amount under an on demand guarantee that the parent company of the seller has provided in favour of our Company. The guarantee covers a loan our Company has extended to the seller. This amount of $26.8m is included in current assets pending the outcome of the arbitration.
We are entitled to 9% p.a. interest of the outstanding amount pending the outcome of the arbitration. The interest income has not been recognized in the accounts for 2010. We believe that we have a good case. However, if we should lose the Nordic Galaxy arbitration on all claims, the claims in total of the seller of $26.8m translates into approximately $0.60 per share. The outcome of the arbitration will not impact the dividend going forward.
As announced in our 3Q10 report on November 5, 2010, the Company has had no equity incentive plan since the stock options under the 2004 Stock Incentive Plan were exercised in 2009. In 2011 the Board of Directors has decided to establish a new incentive plan involving a maximum of 400,000 restricted shares of which 326,000 shares have been allocated among 23 persons employed in the management of the Company, the Manager and the members of the Board. These allocated shares constitute 0.7% of the outstanding shares of the Company. The vesting period is 4 year "cliff vesting", that is, none of these shares may be sold during the first four years after grant and the shares are forfeited if the grantee leaves the Company before that time. The Board considers this arrangement to be in the best interests of the shareholders and of the Company.
For further details on our financial position for 4Q10, 3Q10, 4Q09 and the twelve months ended December 31, 2010 and 2009, please see later in this release.
Corporate Governance/Conflict of Interests
As advised shareholders, on September 23, 2010 the New York Stock Exchange Commission presented its final report on Corporate Governance. The Commission achieved consensus on 10 core principles. These principles include a) building long-term sustainable growth in shareholder value for the corporation as the board`s fundamental objective, b) the critical role of management in establishing proper corporate governance, c) good corporate governance should be integrated with the company`s business strategy and objectives and d) transparency for corporations and investors, sound disclosure policies and communication beyond disclosure. We believe the principles presented are key elements of good corporate governance and we believe that the Company is in compliance with these principles.
It is very important for NAT to ensure that there is no conflict of interests among shareholders, management, affiliates and related parties. The interests must be aligned. It is intolerable to have conflicts of interest among shareholders, management, affiliates and related parties. We will ensure that there is transparency related to transactions with affiliates and/or related parties.
The Fleet
The Company has a fleet of 19 vessels including 2 newbuildings. By way of comparison, in the autumn of 2004, the Company had three vessels; at the end of 2005 the Company had eight vessels; and at the end of 2006 the Company had 12 vessels. At the end of 2009 we had 15 vessels in operation. At the end of December 31, 2010 we had a fleet of 17 vessels excluding two newbuildings. Please see the fleet list below. We expect that the expansion process will continue and that further vessels will be added to our fleet.
The Nordic Harrier (ex Gulf Scandic) was redelivered to the Company in October last year and went directly into drydock for overhaul. The drydock period could last up to end March 2011 after which the vessel will be employed in the Gemini suezmax cooperation. Our company will claim the bareboat charterer to pay for the relevant docking and other costs that are their obligation to cover under the bareboat charter.
Total offhire for 4Q10 was 8 days for our trading fleet. The time out of service for the Nordic Harrier is excluded from the offhire calculation as the ship is expected to commence trading for our account in late March 2011.
World Economy and the Tanker Market
In our quarterly reports to shareholders we have often stressed the significance of the development of the world economy for the tanker industry. The outlook for the world economy is presently uncertain. The tanker markets rates are also affected by newbuildings which enter the markets. As a matter of policy the Company does not attempt to predict future spot rates.
The average daily rate for our spot vessels was $14,400 per day net to us during 4Q10 compared with $17,525 per day for 3Q10. In a low market the vessels may be waiting to get a cargo while in a more robust market environment waiting days are minimized.
Link to the graph: http://hugin.info/201/R/1488489/423906.pdf
The graph above shows the average yearly spot rates since 2000 as reported by R.S. Platou Economic Research a.s. The rates as reported by shipbrokers and by Imarex may vary from the actual rates we achieve in the market, but these rates are in general a good indication of the level of the market.
Strategy going forward
We believe that the operating model of the Company is working to the benefit of our shareholders. Transparency is very important for NAT.
The financial turmoil and depressed shipping markets provide attractive opportunities for expansion.
Our objective is to have a strategy that is flexible for both a strong shipping market and a weak shipping market. If the market is strong, good results and dividends can be expected. If the market is weaker, dividends will be lower. However, if rates remain low, the Company is in a position to buy vessels inexpensively by historical standards, paving the way for even higher dividends when the market strengthens again. In this way, the Company has covered both scenarios.
After an acquisition of vessels or other forms of expansion, the Company should be able pay a higher dividend per share and produce higher earnings per share than had such an acquisition not taken place.
Our full dividend payout policy will continue to enable us to achieve a competitive risk adjusted cash yield over time compared with that of other tanker companies.
Our Company is well positioned. To the best of our ability we shall endeavor to safeguard and further strengthen this position for our shareholders in a deliberate and transparent way.
[1] Total Return is defined as stock price plus dividends, assuming dividends are reinvested in the stock
[2] Operating cash flow is a non-GAAP number. Please see later in this announcement for a reconciliation of operating cash flow to income from vessel operations.
The Company desires to take advantage of the safe harbor provisions of the Private Securities Litigation Reform Act of 1995 and is including this cautionary statement in connection with this safe harbor legislation. The words "believe," "anticipate," "intend," "estimate," "forecast," "project," "plan," "potential," "may," "should," "expect," "pending" and similar expressions identify forward-looking statements.
The forward-looking statements in this press release are based upon various assumptions, many of which are based, in turn, upon further assumptions, including without limitation, our management's examination of historical operating trends, data contained in our records and other data available from third parties. Although we believe that these assumptions were reasonable when made, because these assumptions are inherently subject to significant uncertainties and contingencies which are difficult or impossible to predict and are beyond our control, we cannot assure you that we will achieve or accomplish these expectations, beliefs or projections. We undertake no obligation to update any forward-looking statement, whether as a result of new information, future events or otherwise.
Important factors that, in our view, could cause actual results to differ materially from those discussed in the forward-looking statements include the strength of world economies and currencies, general market conditions, including fluctuations in charter rates and vessel values, changes in demand in the tanker market, as a result of changes in OPEC's petroleum production levels and world wide oil consumption and storage, changes in our operating expenses, including bunker prices, drydocking and insurance costs, the market for our vessels, availability of financing and refinancing, changes in governmental rules and regulations or actions taken by regulatory authorities, potential liability from pending or future litigation, general domestic and international political conditions, potential disruption of shipping routes due to accidents or political events, vessels breakdowns and instances of off-hire, failure on the part of a seller to complete a sale to us and other important factors described from time to time in the reports filed by the Company with the Securities and Exchange Commission, including the prospectus and related prospectus supplement, our Annual Report on Form 20-F, and our Reports on Form 6-K.
4Q10 dividend report: http://hugin.info/201/R/1488489/423906.pdf
Disclosure I am Long NAT shares.
http://hugin.info/201/R/1488489/423906.pdf
Nordic American Tanker Shipping Ltd. ("NAT" or "the Company") announced today that the Company has declared a dividend of $0.25 per share for 4Q10, the same dividend as for 4Q09. The dividend policy will continue. The Company has a very strong balance sheet and we shall protect this position.
The Company will pay the dividend of $0.25 per share on or about March 4, 2011 to shareholders of record as of February 24, 2011. After the first three vessels were delivered in the autumn 1997, NAT has always paid a quarterly dividend; including the dividend for 4Q10 the total dividend payment amounts to $41.84 per share.
Including two newbuildings there are now 19 vessels in our fleet of which 15 vessels were trading during 4Q10. At the end of 2011 we expect to have a minimum of 19 vessels trading, representing a substantial increase in earnings and dividend capacity as vessels are being phased in during 2011. The Company remains committed to its strategy of dividend accretive growth and a strong balance sheet. This financial position of NAT is particularly important in a soft market when some tanker companies are experiencing financial difficulties.
Going forward the Company will continue to focus on accretive growth through acquisitions and on keeping the average age of the fleet low. The Company is pursuing a disciplined investment policy. We encourage investors wishing to receive dividends and to have exposure to the tanker sector to assess our model and invest in our Company.
The key points:
- We will continue our dividend payout policy. The Board has declared a dividend of $0.25 per share for 4Q10.
- Earnings per share in 4Q10 were -$0.27 of which $0.05 were related to non-recurring items. Earnings were -$0.10 per share in 4Q09. The operating cash flow was $5.2m in 4Q10 compared with $10.5m in 4Q09. In December 2010, NAT took delivery of the suezmax newbuilding Nordic Vega.
- All our trading vessels are now in the Gemini suezmax cooperative arrangement. We are pleased with this cooperation which ensures efficiency in our commercial operations.
- The Gulf Scandic -- now Nordic Harrier -- was on a long term fixed contract that expired in 3Q10. The vessel was redelivered to us in October 2010 and is now in drydock as it was not in a contractual condition on redelivery. The vessel is expected to commence trading in late March 2011.
- In 4Q10 the total offhire was about 8 days for the trading fleet -- a very satisfactory performance.
- We continue to retain focus on cost efficiency -- both in the administration and onboard the vessels.
- The Company does not engage in any type of derivatives.
- The piracy situation in the Gulf of Aden and in the Indian Ocean is of great concern. The Company is taking protective measures to safeguard crew and assets.
- Towards the end of 2010 there was a certain improvement in the spot market, although modest. However, the market has since then been weak so far in 2011. Going forward, rates may change quickly and unexpectedly. As a matter of policy the Company does not attempt to predict future spot rates.
The Company will continue to keep a strong balance sheet with no or little net debt.
The Company is also in a good position to take advantage of strong shipping markets, which will translate into increased dividend payouts. When the market is down we do not "cut" the dividend, we adjust it, depending upon the general spot market freight level for suezmax tankers.
Below is a chart indicating the annual dividend capacity based on a fleet of 20 vessels and 24 vessels at different spot market rates and today's sharecount.
Link to the graph: http://hugin.info/201/R/1488489/423906.pdf
The above is based on 355 income days per vessel per year. The net debt will be about $7m per vessel with a cash break-even level of $11,300 per day per vessel for a 20 vessel fleet. The graph shows the substantial dividend capacity of NAT.
We see that prices for second hand vessels have softened. Should this development continue, we shall be in a position to acquire further vessels inexpensively compared to historical levels. Such acquisitions would increase the dividend capacity of the Company. It is a prerequisite for any expansion of the fleet that the dividend and earnings capacity per share will increase.
When the freight market is above the cash break-even level, the Company can be expected to pay a dividend. The breakeven rate is the amount of average daily revenues our vessels would need to earn in the spot market in order to cover our vessel operating expenses, voyage expenses, if any, cash general and administrative expenses, interest expense and other financial charges.
The annual spot rates as reported by R.S. Platou Economic Research a.s. show that during the last 11 years up to the end of 2010, 7 years have produced about $40,000 on average per day per vessel or more. This is reflected in the graph later in this report.
The tightened terms of commercial bank financing and higher margins on shipping loans are challenging for debt-laden shipping companies. By having no or little net debt, NAT is better positioned to navigate the financial seas, as we believe this is in the best interests of our shareholders.
Our primary objective is to maximize total return[1] to our shareholders, including maximizing our quarterly cash dividend.
The Company has further acquisitions under evaluation and will work to continue to strengthen its position compared with that of its competitors.
Financial Information
The Board has declared a dividend of $0.25 per share in respect of 4Q10 to shareholders of record as of February 24, 2011 compared with $0.25 per share for 4Q09 and $0.25 share for 3Q10. The average number of shares outstanding for the fourth quarter of 2010 was 46,898,782 -- the same as at the end of 3Q10. The market capitalization of the Company stood at $1.2 billion as of February 11, 2011. It is important to have a sizable market capitalization in order to provide for good liquidity in the share.
The Company's operating cash flow[2] was $5.2m for 4Q10, compared to $10.5m for 4Q09.
We consider our general and administrative costs per day per vessel to be at a low level. We also continue to concentrate on keeping our vessel operating costs low, while always maintaining our commitment to safe vessel operations. We in particular focus on cost synergies of operating a homogenous fleet.
At the time of this report, the Company has no net debt and has a revolving credit facility of $500m of which $75m has been drawn. The credit facility, which matures in September 2013, is not subject to reduction by the lenders and there is no obligation to repay principal during the term of the facility. The Company pays interest only on drawn amounts and a commitment fee for undrawn amounts.
Several publicly traded tanker companies have significant debt, which could make it difficult for them to buy vessels in a weak market.
The table below gives the annual dividend payments as well as quarterly dividend payments for the past 13 years -- the dividends are essentially based on earnings and operating cashflow in the preceeding quarter.
Link to the graph: http://hugin.info/201/R/1488489/423906.pdf
As reported earlier, the Company did not take delivery of a newbuilding (Nordic Galaxy) in August 2010 as it was not in a deliverable condition. This vessel will not join our fleet. We have debited the profit & loss account by a one-time charge of $1.5m related to direct costs of this newbuilding. We will claim this amount from the seller of the vessel as one component in the arbitration process. The parent company (First Olsen Ltd.) of the seller has not repaid an amount under an on demand guarantee that the parent company of the seller has provided in favour of our Company. The guarantee covers a loan our Company has extended to the seller. This amount of $26.8m is included in current assets pending the outcome of the arbitration.
We are entitled to 9% p.a. interest of the outstanding amount pending the outcome of the arbitration. The interest income has not been recognized in the accounts for 2010. We believe that we have a good case. However, if we should lose the Nordic Galaxy arbitration on all claims, the claims in total of the seller of $26.8m translates into approximately $0.60 per share. The outcome of the arbitration will not impact the dividend going forward.
As announced in our 3Q10 report on November 5, 2010, the Company has had no equity incentive plan since the stock options under the 2004 Stock Incentive Plan were exercised in 2009. In 2011 the Board of Directors has decided to establish a new incentive plan involving a maximum of 400,000 restricted shares of which 326,000 shares have been allocated among 23 persons employed in the management of the Company, the Manager and the members of the Board. These allocated shares constitute 0.7% of the outstanding shares of the Company. The vesting period is 4 year "cliff vesting", that is, none of these shares may be sold during the first four years after grant and the shares are forfeited if the grantee leaves the Company before that time. The Board considers this arrangement to be in the best interests of the shareholders and of the Company.
For further details on our financial position for 4Q10, 3Q10, 4Q09 and the twelve months ended December 31, 2010 and 2009, please see later in this release.
Corporate Governance/Conflict of Interests
As advised shareholders, on September 23, 2010 the New York Stock Exchange Commission presented its final report on Corporate Governance. The Commission achieved consensus on 10 core principles. These principles include a) building long-term sustainable growth in shareholder value for the corporation as the board`s fundamental objective, b) the critical role of management in establishing proper corporate governance, c) good corporate governance should be integrated with the company`s business strategy and objectives and d) transparency for corporations and investors, sound disclosure policies and communication beyond disclosure. We believe the principles presented are key elements of good corporate governance and we believe that the Company is in compliance with these principles.
It is very important for NAT to ensure that there is no conflict of interests among shareholders, management, affiliates and related parties. The interests must be aligned. It is intolerable to have conflicts of interest among shareholders, management, affiliates and related parties. We will ensure that there is transparency related to transactions with affiliates and/or related parties.
The Fleet
The Company has a fleet of 19 vessels including 2 newbuildings. By way of comparison, in the autumn of 2004, the Company had three vessels; at the end of 2005 the Company had eight vessels; and at the end of 2006 the Company had 12 vessels. At the end of 2009 we had 15 vessels in operation. At the end of December 31, 2010 we had a fleet of 17 vessels excluding two newbuildings. Please see the fleet list below. We expect that the expansion process will continue and that further vessels will be added to our fleet.
| Vessel | Dwt | Employment | ||||||
| Nordic Harrier | 151,475 | In drydock up to approx. end of March 2011, and then spot. | ||||||
| Nordic Hawk | 151,475 | Spot | ||||||
| Nordic Hunter | 151,400 | Spot | ||||||
| Nordic Voyager | 149,591 | Spot | ||||||
| Nordic Fighter | 153,328 | Spot | ||||||
| Nordic Freedom | 163,455 | Spot | ||||||
| Nordic Discovery | 153,328 | Spot | ||||||
| Nordic Saturn | 157,332 | Spot | ||||||
| Nordic Jupiter | 157,411 | Spot | ||||||
| Nordic Cosmos | 159,998 | Spot | ||||||
| Nordic Moon | 159,999 | Spot | ||||||
| Nordic Apollo | 159,999 | Spot | ||||||
| Nordic Sprite | 147,188 | Spot | ||||||
| Nordic Grace | 149,921 | Spot | ||||||
| Nordic Mistral | 164,236 | Spot | ||||||
| Nordic Passat | 164,274 | Spot | ||||||
| Nordic Vega | 163,000 | Spot | ||||||
| Nordic Breeze | 158,000 | Delivery expected in 3Q11 | ||||||
| Nordic Zenith | 158,000 | Delivery expected in 4Q11 | ||||||
| Total | 2,973,410 | |||||||
The Nordic Harrier (ex Gulf Scandic) was redelivered to the Company in October last year and went directly into drydock for overhaul. The drydock period could last up to end March 2011 after which the vessel will be employed in the Gemini suezmax cooperation. Our company will claim the bareboat charterer to pay for the relevant docking and other costs that are their obligation to cover under the bareboat charter.
Total offhire for 4Q10 was 8 days for our trading fleet. The time out of service for the Nordic Harrier is excluded from the offhire calculation as the ship is expected to commence trading for our account in late March 2011.
World Economy and the Tanker Market
In our quarterly reports to shareholders we have often stressed the significance of the development of the world economy for the tanker industry. The outlook for the world economy is presently uncertain. The tanker markets rates are also affected by newbuildings which enter the markets. As a matter of policy the Company does not attempt to predict future spot rates.
The average daily rate for our spot vessels was $14,400 per day net to us during 4Q10 compared with $17,525 per day for 3Q10. In a low market the vessels may be waiting to get a cargo while in a more robust market environment waiting days are minimized.
Link to the graph: http://hugin.info/201/R/1488489/423906.pdf
The graph above shows the average yearly spot rates since 2000 as reported by R.S. Platou Economic Research a.s. The rates as reported by shipbrokers and by Imarex may vary from the actual rates we achieve in the market, but these rates are in general a good indication of the level of the market.
Strategy going forward
We believe that the operating model of the Company is working to the benefit of our shareholders. Transparency is very important for NAT.
The financial turmoil and depressed shipping markets provide attractive opportunities for expansion.
Our objective is to have a strategy that is flexible for both a strong shipping market and a weak shipping market. If the market is strong, good results and dividends can be expected. If the market is weaker, dividends will be lower. However, if rates remain low, the Company is in a position to buy vessels inexpensively by historical standards, paving the way for even higher dividends when the market strengthens again. In this way, the Company has covered both scenarios.
After an acquisition of vessels or other forms of expansion, the Company should be able pay a higher dividend per share and produce higher earnings per share than had such an acquisition not taken place.
Our full dividend payout policy will continue to enable us to achieve a competitive risk adjusted cash yield over time compared with that of other tanker companies.
Our Company is well positioned. To the best of our ability we shall endeavor to safeguard and further strengthen this position for our shareholders in a deliberate and transparent way.
[1] Total Return is defined as stock price plus dividends, assuming dividends are reinvested in the stock
[2] Operating cash flow is a non-GAAP number. Please see later in this announcement for a reconciliation of operating cash flow to income from vessel operations.
CAUTIONARY STATEMENT REGARDING FORWARD-LOOKING STATEMENTS
Matters discussed in this press release may constitute forward-looking statements. The Private Securities Litigation Reform Act of 1995 provides safe harbor protections for forward-looking statements in order to encourage companies to provide prospective information about their business. Forward-looking statements include statements concerning plans, objectives, goals, strategies, future events or performance, and underlying assumptions and other statements, which are other than statements of historical facts.The Company desires to take advantage of the safe harbor provisions of the Private Securities Litigation Reform Act of 1995 and is including this cautionary statement in connection with this safe harbor legislation. The words "believe," "anticipate," "intend," "estimate," "forecast," "project," "plan," "potential," "may," "should," "expect," "pending" and similar expressions identify forward-looking statements.
The forward-looking statements in this press release are based upon various assumptions, many of which are based, in turn, upon further assumptions, including without limitation, our management's examination of historical operating trends, data contained in our records and other data available from third parties. Although we believe that these assumptions were reasonable when made, because these assumptions are inherently subject to significant uncertainties and contingencies which are difficult or impossible to predict and are beyond our control, we cannot assure you that we will achieve or accomplish these expectations, beliefs or projections. We undertake no obligation to update any forward-looking statement, whether as a result of new information, future events or otherwise.
Important factors that, in our view, could cause actual results to differ materially from those discussed in the forward-looking statements include the strength of world economies and currencies, general market conditions, including fluctuations in charter rates and vessel values, changes in demand in the tanker market, as a result of changes in OPEC's petroleum production levels and world wide oil consumption and storage, changes in our operating expenses, including bunker prices, drydocking and insurance costs, the market for our vessels, availability of financing and refinancing, changes in governmental rules and regulations or actions taken by regulatory authorities, potential liability from pending or future litigation, general domestic and international political conditions, potential disruption of shipping routes due to accidents or political events, vessels breakdowns and instances of off-hire, failure on the part of a seller to complete a sale to us and other important factors described from time to time in the reports filed by the Company with the Securities and Exchange Commission, including the prospectus and related prospectus supplement, our Annual Report on Form 20-F, and our Reports on Form 6-K.
4Q10 dividend report: http://hugin.info/201/R/1488489/423906.pdf
Disclosure I am Long NAT shares.
Subscribe to:
Posts (Atom)