Your Ad Here

Friday, February 18, 2011

Bottom Line: Stick With The Juniors In Gold ETFs (GDX, GDXJ, GLD)

In covering the gold sector for my premium subscribers, I have  noticed something lately. The large-caps really suck! Ok, that is harsh  but it is the truth.


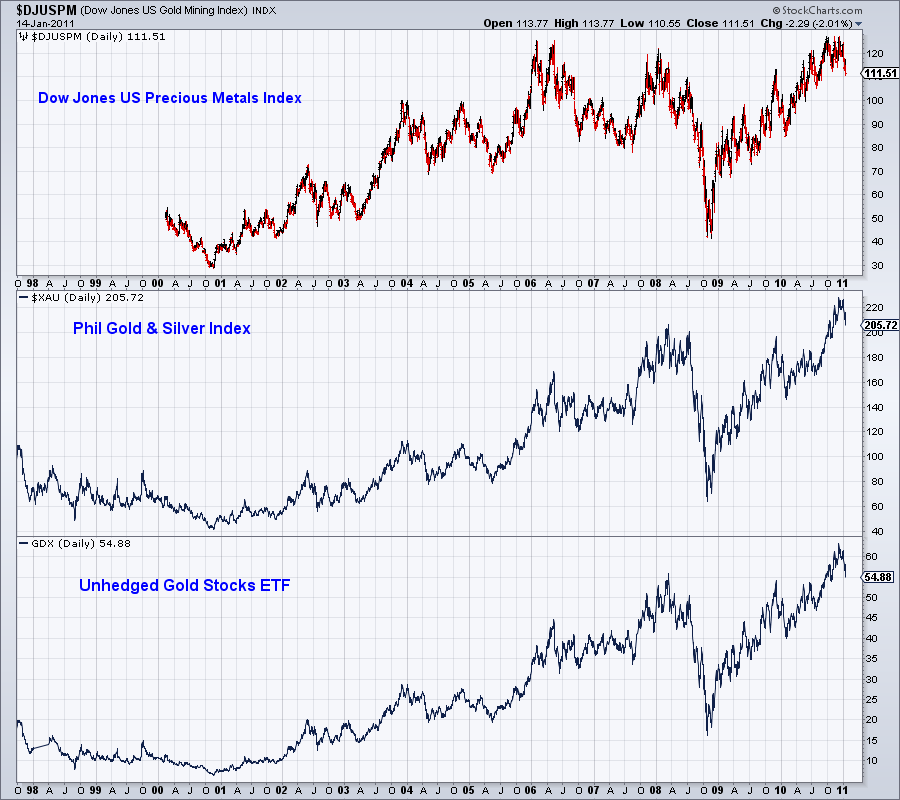
In the chart below I show the large-cap indices. What do you see?


The Dow Jones Precious Metals Index hasn’t gone anywhere for five  years, while Gold has m
ore than doubled. The next two the XAU and the  Market Vectors Gold Miners ETF (NYSE:GDX) are trading right at their  2008 peaks. Since then, I quickly calculate that Gold and Silver are  higher by about 33%.

We all know that the Market Vectors Junior Gold Miners ETF  (NYSE:GDXJ) outperformed GDX in 2010. It wasn’t close and even during  this correction GDXJ is holding up better.
Yet, GDXJ is weighted heavily in some companies that are above $1  Billion in market cap. Where is the “junior” in that? I created my own  index of 25 gold stocks, which are equally weighted and range mostly  from $200-$700 million in market cap.

My junior index against the HUI (GDX follows the HUI) is moving  higher after an 8-year breakout. This chart tells us that the juniors  should outperform strongly in 2011 and likely 2012.


We’ve written about this before but it bears hearing again.

Too often we hear about how gold stocks are cheap and how they are  priced for $1000 Gold or $800 Gold. Just because the HUI/Gold or  XAU/Gold ratio is low doesn’t mean the sector is at a bottom. The  reality is that large gold stocks have consistently underperformed Gold  over time. Take a look at this piece from Steve Saville and his chart which goes back to 1960.

Steve attributes the poor performance to rising costs, management  errors, environmental and political factors but most importantly,  depletion. Just to stay in business gold companies have to consistently  find new deposits, mine those deposits and add to reserves. The larger a  company is, the more difficult it is to do these things. A junior  company can grow by building a few small mines. A large-cap needs to  find huge deposits that can become huge mines. It is simply a more  difficult business for the larger sized companies.

It is critical that investors and speculators take note of all these  factors before partaking in the sector. I fear that the new entrants in  the sector will think they are safe by buying Newmont or Barrick. They  may be less volatile, but history argues you are better off holding Gold  or Silver.

Sure the juniors have already had a fantastic run, but our chart  argues that it may be even better in the next few years. As the bull  market rages on, the herd will naturally become more speculative. The  large players have begun to resort to takeovers and acquisitions. This  will continue and further catalyze the junior sector.  Related ETF: SPDR  Gold Shares ETF (NYSE:GLD)

Disclosure I am long IAU and SLV shares.

A Cheaper Dollar Will Open The Door For These Chinese Investments (UUP, MUB, TCK, CCJ, GMO, PWR)

On January 18th and 19th, the top officials of the two most powerful  nations on Earth are to meet in matters of far reaching significance.   There will be not one but two dinners.  One is to be a grand dinner  of state with all of the military and business leaders of both sides in  attendance.  The other is to be an “intimate” dinner.  Oh, to be a fly  on the wall of that private meeting.


Behind the photo-ops and the speeches there is one basic reality,  China and America are joined inseparably at the hip in a single entity,  which I am calling “The Chinamese Twins.”  As in all such pairings each  head can have their own separate and distinct personalities.  The fact  remains you can call one capitalism and the other communism, but both  heads are mutually dependent on a single life support system.  The world  financial network provides circulatory nourishment to both heads whose  interests are complementary.
 
Washington needs the cheap dollar (NYSE:UUP) to pay off colossal  debts.  China needs to revalue its Yuan to counter domestic inflation in  such areas as food and basic consumer goods.  The Chinese have raised  interest rates and bank reserve rules, to little avail.  At the same  time the Chinese do not want to dry up credit which would impede their  growing economy or slowdown exports.
A current headline in the Wall St. Journal reads, “The Bank Of China  Moves to Make Yuan a Global Currency.”  This will come as no surprise to  goldstocktrades.com readers.  In an article I wrote back in November, I spoke about China and Russia beginning to trade in Yuan and Rubles causing the need for the Yuan to be revalued higher.

The Chinese economy is thriving and they can well afford to revalue  the Yuan higher.  This stronger yuan will make North American resource  assets cheaper and put China in the driver’s seat to control many of the  large undeveloped assets.  At the same time they are buying gold,  silver and uranium assets hand over fist to hedge themselves from a U.S.  dollar decline, in which they own the largest interest.  In 2009 the  Chinese Investment Corporation, a state owned company, took large  ownership positions in Teck Cominco (NYSE:TCK) and Penn West Energy  Trust (NYSE:PWR). Recently in June, China National Nuclear signed a  contract with Cameco (NYSE:CCJ) to supply 23 million pounds of uranium.   Hanlong Investments took a large stake in General Moly (AMEX:GMO), one  of the leading North American molybdenum developers.

They want more  gold and silver to support the Yuan in order to ensure that when the  Yuan becomes the major world currency, it will be more resistant to the  swings encountered by fiat currencies.  Additionally, they also want  more precious metals to buttress its fiscal balance sheet and what they  feel is the eventual replacement of the U.S. Dollar as the world’s  reserve currency.  They are also rapidly developing and modernizing  increasing their use of uranium, potash, molybdenum, rare earths, coal  and oil and gas.

By revaluing the Yuan higher, China will be able to control inflation  and rising costs.  A higher Yuan will also benefit the Chinese  investment side which has already been active making deals in North  America.  The U.S. dollar will significantly be cheaper for the Chinese  which would allow them to acquire North American assets for pennies on  the dollar.  Just recently the Chinese Investment Corporation, whose  focus is to look for investment opportunities abroad opened its first  international branch in Toronto, which is the North American epicenter  of resource  companies.   Its one billion plus people can enjoy more  purchasing power through a higher yuan and a higher standard of living  with a supply of North American natural resources which could fuel their  rapid development.

Beyond the blustering and posturing at these dinners the trade off is  that they want carte blanche to enter more strongly into the heart of  capitalism and the North American resource sector.  Here the Chinese can  get all the gold, silver and natural resource deals they want.  Doors  will quietly swing open and everyone will go home happy.  The Chinese  will have their desired access to buy gold and natural resource stocks,  while The Americans receive a weaker dollar with which to pay off their  burgeoning debts.  If you are thinking that such a Byzantine arrangement  can’t be done, be assured it has all happened before.  During the  1980’s the USSR sold large amounts of gold secretly in New York.  It  took three years to become public knowledge.

Another part of this “Chinamese” agreement concerns rare metals, on  which the Chinese head wants to maintain its strategic grip of over 95%  of the world’s supply.  I feel the U.S. will not make this an issue.   The U.S. will accommodate China in order to persuade them to raise the  Yuan higher and the dollar lower.  I feel this revaluation will be done  in a series of two or three steps in 2011, which should eventually move  precious metals into new high territories and crush the U.S. dollar.   Volatile sell offs in gold and silver like I predicted in November and  December, which we are currently experiencing now, may present long term  precious metal investors with buying opportunities.

Underneath all of the media hype and adversarial stories between  China and America, I read a front page story in the New York Times of  1-17-11, “GE To Share Jet Technology With China In A New Joint  Venture.”  Expect to hear more deals in 2011 in which the Chinese  continue to invest in natural resource assets in North America, while  the U.S. continues to search for a way out of the financial  crisis.   

  We may see further bailouts from the federal government as  many states are in danger of defaulting.  The bankrupt states are  already asking Washington for assistance.  This devaluation of the  dollar that Geithner and Obama are asking for is to help the US pay off  its debts and be able to raise its debt ceiling with cheap devalued  dollars.  This should be bullish for precious metal prices where  investors will seek shelter from soaring government deficits and a loss  of the U.S. dollar as the world reserve currency.  See the iShares  S&P National AMT-Free Muni Bond ETF (NYSE:MUB) chart below:

Disclosure None

U.S. Small Cap Blend ETF Rankings

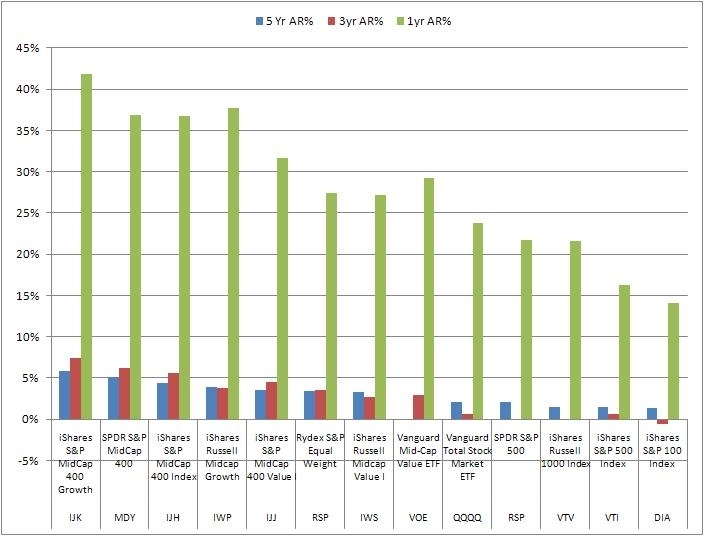
In this article, we  start with our US Small Cap ETF rankings. We have already completed  large and medium cap ETFs and have derived a performance graph for the  ones we selected to potentially use in an ETF plan.

click to enlarge
In this article, we move on to small cap blend ETFs with the goal of providing the same ranking.
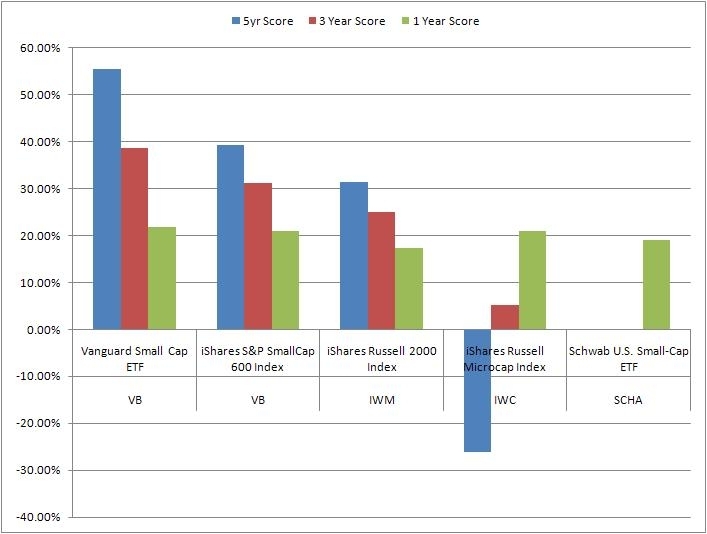
We rank and determine a cutoff based on trading volume for liquidity and lowtrading friction, then rank them based on their returns and assign a score. We start with a fuller list of small cap blend ETFs:
                                                                                                                                                                                                                                                                                                                                                                                                                                                                                                                                                                                                                                                     
SymbolName
IWMiShares Russell 2000 Index
IJRiShares S&P SmallCap 600 Index
VBVanguard Small Cap ETF
IWCiShares Russell Microcap Index
SCHASchwab U.S. Small-Cap ETF
PRFZPowerShares FTSE RAFI US 1500
JKJiShares Morningstar Small Core
RWJRevenueShares Small Cap
PZIPowerShares Zacks Micro Cap
FYXFirst Trust Small Cap Core Alp
FDMFirst Trust Dow Jones Select M
SLYSPDR S&P 600 Small Cap ETF
WMCRWilshire Micro-Cap ETF
VTWOVanguard Russell 2000 Index ET
PJMPowerShares Dynamic Small Cap
EWRSRydex Russell 2000 Equal Weigh
VIOOVanguard S&P Small-Cap 600 Ind

We now apply trading volume data  for us to be able to reduce the number of ETFs that we examine. We want  to make sure we maximize liquidity and minimize trading friction. We  are going to draw the line at around 200,000 although we will let the  Schwab ETF squeak in just under the bar at around 190,000. This gives us  five ETFs.

                                                                                                                                                                                                                                                                                                                                                                                                                                                           
TickerDescription5 Yr AR%3yr AR%1yr AR%
VBVanguard Small Cap ETF4.00%5.40%37.07%
IJRiShares S&P SmallCap 600 Idx2.83%4.37%35.61%
IWMiShares Russell 2000 Index2.26%3.50%29.63%
IWCiShares Russell Microcap Index-1.89%0.74%35.77%
SCHASchwab U.S. Small-Cap ETF0.00%0.00%32.36%


We will select the top three although VB and IJR seem to be head and shoulders above the rest of the bunch.

                                                                                                                                                                                                                                                                                                                                                                                                                                                                                                                                                                                                                                                                                                                                                                                                                                                                                                                                                                                                            
TickerProperty2004 2005 2006 2007 2008 2009 2010 2011
VBDraw Down(%)12.00 9.04 13.15 13.31 51.92 32.54 20.01 3.69
Return(%)15.29 7.10 15.50 0.96 (37.61)36.39 28.58 3.19
IJRDraw Down(%)11.07 10.94 13.98 14.44 48.42 33.34 19.29 3.58
Return(%)21.43 6.57 14.17 (1.47)(31.70)24.45 27.33 2.13
IWMDraw Down(%)14.41 12.16 14.14 13.90 49.44 32.90 20.09 4.23
Return(%)16.88 3.04 16.95 (2.73)(34.48)26.81 26.49 1.55


So VB and IJR are selected for Mid Cap Blend ETFs.


I have no positions in any stocks mentioned, but plan to initiate a long position in IWM over the next 10 days.

ETF To Watch: Silver Miners ETF (SIL)

2010 was a kind year to mining companies as the prices for their main outputs soared, outpacing gains for the overall market. However, as the calendar turned to 2011 investors began to quickly abandon their bets on the precious metal industry leading to a huge sell-off in a number of key mining names. This trend was especially pronounced in the the silver market where the white metal led on the upside but also was one of the biggest decliners to start the year.


However, the silver market has managed to balance out over the last few weeks posting strong gains thanks to rising inflation fears as well as geopolitical concerns across much of the Middle East. Thanks to this uncertainty, investors in the sector should be paying especially close attention to one of the key companies in the industry, Pan American Silver Corp (PAAS).

PAAS, the Vancouver, Canada-based silver mining giant was scheduled to report its Q4 results after the bell on Tuesday and it also looks to host a conference call during market hours today to discuss the results. Although results were not disclosed at the time of writing, analysts expect the company to post earnings of 46 cents a share, a 15 cent increase from the year ago period, reflecting the rapid increase in the price of silver since the company reported its Q4 2009 numbers


Thanks to this key earnings report from one of the biggest pure silver miners in the world, we have decided to make the Silver Miners ETF (SIL) today’s ETF to watch. The fund tracks the Solactive Global Silver Miners Index which is designed to reflect the performance of the silver mining industry. It is comprised of common stocks, ADRs and GDRs of selected companies globally that are actively engaged in some aspect of the silver mining industry such as silver mining, refining or exploration.

In addition to its 10% weighting in PAAS, the fund also gives high weightings to Industrias Pensoles SAB, Silver Wheaton, and Fresnillio, three other companies that make up at least 10% of SIL’s total assets. Over the past 52 weeks, SIL has surged by a remarkable 65.7% including a 64% gain over the past half year period. However, the fund has lost close to 10% in 2011 but it has posted a solid February, gaining 8.1% back in just two weeks. Should PAAS deliver with solid results and an optimistic outlook, the February run could easily continue into this week as well. If, however, PAAS is unable to match Street expectations, the Canadian company– as well as the broad silver mining industry– could see a quick return to the January 2011 environment in which precious metal miners were under significant pressure.


 Disclosure I am Long SIL shares.

Thursday, February 17, 2011

New Currency-Hedged ETFs Coming Soon

There are 5 new currency-hedged ETFs in the works from Deutsche Bank...

* DBBR - DBX Brazil Currency-Hedged Equity Fund
* DBCN - DBX MSCI Canada Currency-Hedged Fund
* DBEM - DBX MSCI Emerging Markets Currency-Hedged Equity Fund
* DBEF - DBX MSCI EAFE Currency-Hedged Equity Fund
* DBJP - DBX MSCI Japan Currency-Hedged Equity Fund

The strategy behind the new ETFs is utilize forward contracts to keep fluctuations in the price of the currencies under control and minimize the risk.

The new funds are near launch and just recently disclosed their underlying benchmarks. And as you can see, they have their names and symbols. When they are ready to go, I'll be sure to let you know, so stay tuned.

Disclosure none

New Junk Bond ETFs

New Junk Bond ETFs
Wednesday February 9, 2011

Today we have 4 new target-date junk bond ETFs from Guggenheim (formerly known as Claymore)...

* BSJC - The Guggenheim Bulletshares 2012 High Yield Corporate Bond ETF
* BSJD - The Guggenheim Bulletshares 2013 High Yield Corporate Bond ETF
* BSJE - The Guggenheim Bulletshares 2014 High Yield Corporate Bond ETF
* BSJF - The Guggenheim Bulletshares 2015 High Yield Corporate Bond ETF

The company had seven similar ETFs launch last June, but they were not high yield corporate bond ETFs like these. And Guggenheim has plans for some more of these target-date ETFs, that extend beyond these years.

There's no doubt junk bond ETFs are popular as of late, but investors must be careful in the analysis and research. And as of today these bond ETFs are trading around $25-$26.

Disclosure NONE

Unitil (UTL) Decalares $0.345 Quarterly Dividend; 6% Yield

Unitil Corporation (NYSE: UTL) today announced that its Board of Directors declared the regular quarterly dividend on the Company's common stock of $0.345 per share, $1.38 annualized.

The dividend is payable on February 15, 2011 to shareholders of record on February 1, 2011. The ex-dividend date is January 28, 2011.

Yield on the dividend is 6%.

Disclosure none

Dissipate the Risk In Biotechnology With ETFs

The biotechnology sector offers investors the opportunity to bet big and win big, but the potential downside can make a huge dent in your wallet. Perhaps a biotech exchange traded fund (ETF) is more to your liking?

The largest and most liquid broad-based biotech sector iShares Nasdaq Biotechnology (NASDAQ: IBB), which reflects the performance of the Nasdaq Biotechnology Index, offers the opportunity to gain exposure to biotechs while mitigating the risk from picking out potential duds in the sector, comments Jim Woods for InvestorPlace.

Often, big moves in biotech stocks come from successful stages of drug development. The biggest risk is that one unsuccessful stage, which sends a company back to square one. The biggest reward is approval, of course. [Play the Booming Biotech Sector With ETFs.]

If you believe the sector will be up or down in the short-term, consider ProShares Ultra Biotechnology (NYSEArca: BIB) or ProShares UltraShort NASDAQ Biotechnology (NYSEArca: BIS) to capitalize on quick moves.

If you want to play it straight, then there are these in addition to IBB:
  • SPDR S&P Biotech ETF (NYSEArca: XBI)
  • First Trust Amex Biotech (NYSEAca: FBT)
This year is shaping up to be a good one for biotech companies.
  • The sector has been awash in big mergers. Back in August, Sanofi-Aventis (NASDAQ: SNY) made a $69 a share offer to acquire a troubled Genzyme (NASDAQ: GENZ) with a poor track record, but now, a few bullish Genzyme analysts estimate $80 a share is more suitable, reports Brett Chase for Minyanville.  [Deal-Making Drives ETFs Higher.]
  •  
  • Demand for pharmaceuticals has stayed fairly consistent, even through the recession. Emerging market demand is expected to help pick up any slack.
Disclosure None
Dividend payers deserve a berth in any long-term stock portfolio. But seemingly attractive dividend yields are not always as fetching as they may appear. Let's see which companies in the tobacco industry offer the most promising dividends.

Yields and growth rates and payout ratios, oh my!

Before we get to those companies, though, you should understand just why you'd want to own dividend payers. These stocks can contribute a huge chunk of growth to your portfolio in good times, and bolster it during market downturns.

As my colleague Matt Koppenheffer has noted: "Between 2000 and 2009, the average dividend-adjusted return on stocks with market caps above $5 billion and a trailing yield of 2.5% or better was a whopping 114%. Compare that to a 19% drop for the S&P 500."

When hunting for promising dividend payers, unsophisticated investors will often just look for the highest yields they can find. While these stocks will indeed pay out the most, the yield figures apply only for the current year. Extremely steep dividend yields can be precarious, and even solid ones are vulnerable to dividend cuts.

When evaluating a company's attractiveness in terms of its dividend, it's important to examine at least three factors:
  1. The current yield
  2. The dividend growth
  3. The payout ratio
If a company has a middling dividend yield, but a history of increasing its payment substantially from year to year, it deserves extra consideration. A $3 dividend can become $7.80 in 10 years, if it grows at 10% annually. (It will top $20 after 20 years.) Thus, a 3% yield today may be more attractive than a 4% one, if the 3% company is rapidly increasing that dividend.

Next, consider the company's payout ratio, which reflects what percentage of income the company is spending on its dividend. In general, the lower the number, the better. A low payout ratio means there's plenty of room for generous dividend increases. It also means that much of the company's income remains in its hands, giving it a lot of flexibility. That money can fund the business's expansion, pay off debt, buy back shares, or even buy other companies. A steep payout ratio reflects little flexibility for the company, less room for dividend growth, and a stronger chance that if the company falls on hard times, it will have to reduce its dividend.

Peering into tobacco

Below, I've compiled some of the major dividend-paying players in the tobacco industry (and a few smaller outfits), ranked according to their dividend yields:

Company
Recent Yield
5-Year Avg. Annual Div. Growth Rate
Payout Ratio
Vector Group (NYSE: VGR) 9.3% 4.5% 241%
Altria (NYSE: MO) 6.3% 9.4%* 80%
Reynolds American (NYSE: RAI) 6.0% 12.6% 103%
Lorillard (NYSE: LO) 5.8% 6.9%* 63%
Philip Morris International (NYSE: PM) 4.5% 11.5%* 63%
British American Tobacco (AMEX: BTI) 2.8% 15.0% 76%
Data: Motley Fool CAPS. *Since 2008.

If you focus on dividend yield alone, you might end up with Vector Group, but it's not necessarily your best bet. Vector's payout ratio is huge, suggesting that its high yield may be illusory.
Instead, let's focus on the dividend growth rate first, where British American Tobacco and Reynolds American lead the way. Reynolds American also has a rather steep payout ratio, though, and British American Tobacco's yield is on the low side.

Just right

As I see it, while most of the companies above are worth a closer look, Altria and Philip Morris International give you the best of everything for a dividend stock. They sport yields above 4%, healthy dividend growth rates, and reasonable payout ratios. They offer some solid income now and a good chance of strong dividend growth in the future. Of course, as with all stocks, you'll want to look into more than just a company's dividend situation before making a purchase decision. Still, these stocks' compelling dividends make them great places to start your search, particularly if you're excited by the prospects for this industry.

Disclosure NONE.

Why Stocks Outperform Bonds

Stocks provide greater return potential than bonds, but with greater volatility along the way. You have probably heard that statement so many times that you simply accept it as a given. But have you ever stopped to ask why? Why have stocks historically produced higher returns than bonds? Why are bonds typically less volatile? Understanding the reasons behind these trends could help you become a better investor. Read on to learn more.


A Basic Example

Imagine that you are starting up a business. You are the sole owner and the only employee. It will take $2,000 to start operations and you only have $1,000, so you borrow the other $1,000 from a friend, promising to pay that friend $100 per year for the next 10 years, at which time you will repay the original $1,000 loan amount. The first year, after all expenses have been paid, including your own salary, you find that your business has earned $500. You pay your friend the $100 promised and keep the remaining $400. Your friend has earned 10% (100/1000) on his loan to you, but you have earned 40% (400/1,000) on your investment.

The next year does not go as well and after all expenses have been paid you find that the business has only earned $100. You pay that $100 to your friend, who has again experienced a 10% return. You on, the other hand, are left with a 0% return, although your two-year return is still around 20% per year. And so it goes.

With each year, you have the opportunity to earn more or less than the friend who loaned you funds. If the business becomes wildly successful, your return will be exponentially higher than your friend's; if things fall apart, you may lose everything. The loan is a contractual arrangement, so if you have to close up shop, whatever money may be left goes to your friend before it goes to you. As such, your position involves greater risk, but with the opportunity of greater return. If there was no possibility of greater return, there would be no reason for you to take the greater risk.

Expanding the Basic Example

Bonds are essentially loans, as in the example above. Investors loan funds to companies or governments in exchange for a bond that guarantees a fixed return and a promise of the return of the original loan amount, known as the principal, at some point in the future.

Stocks are, in essence, partial ownership rights in the company that entitle the shareholder to share in the earnings that may occur and accrue. Some of these earnings may be paid out immediately in the form of dividends, while the rest of the earnings will be retained. These retained earnings may be used to build a larger infrastructure, giving the company the ability to generate even greater future earnings. Other retained earnings may be held for future uses like buying back company stock or making strategic acquisitions. Regardless of the use, if the earnings continue to rise, the price of the stock will normally rise as well.

Stocks have historically delivered higher returns than bonds because, as in the simplified example above, there is a greater risk that, if the company fails, all of the stockholders' investment will be lost. On the flip side, however, there is a return to stockholders that could potentially dwarf what they could earn investing in bonds. Stock investors will judge the amount they are willing to pay for a share of stock based on the perceived risk and the expected return potential – a return potential that is driven by earnings growth. Being predominantly rational as a group, they will calibrate their investments in a manner that properly compensates them for the excess risk they are taking.

The Causes of Volatility
If a bond pays a known, fixed rate of return, what causes it to fluctuate in value? Several interrelated factors influence volatility:

Inflation and the Time Value of MoneyThe first factor is expected inflation. The lower/higher the inflation expectation, the lower/higher the return or yield bond buyers will demand. This is because of a concept known as the time value of money. The time value of money revolves around the realization that a dollar in the future will buy less than a dollar today because its value is eroded over time by inflation. To determine the value of that future dollar in today's terms, you have to discount its value back over time at some rate.
Discount Rates and Present Value

To calculate the present value of a particular bond, therefore, you must discount the future payments from the bond, both in the form of interest payments and return of principal. The higher the expected inflation, the higher the discount rate that must be used and thus the lower the present value. In addition, the farther out the payment, the longer the discount rate is applied, resulting in a lower present value. Bond payments may be fixed and known, but the constantly changing interest-rate environment subjects their payment streams to a constantly changing discount rate and thus a constantly fluctuating present value. Because the original payment stream of the bond is fixed, the changing bond price will change its current effective yield. As the bond price falls, the effective yield rises; as the bond price rises, the effective yield falls.

The discount rate used is not just a function of inflation expectations. Any risk that the bond issuer may default (fail to make interest payments or return the principal) will call for an increase in the discount rate applied, which will impact the bond's current value. Discount rates are subjective, meaning different investors will be using different rates depending on their own inflation expectations and their own risk assessment. The present value of the bond is the consensus of all these different calculations.

The return from bonds is typically fixed and known, but what is the return from stocks? In its purest form, the relevant return from stocks is known as free cash flow, but in practice the market tends to focus on reported earnings. These earnings are unknown and variable. They may grow quickly or slowly, not at all, or even shrink or go negative. To calculate the present value, you have to make a best guess as to what those future earnings will be. To make matters more difficult, these earnings do not have a fixed life. They may continue for decades and decades. To this ever-changing expected return flow, you are applying an ever-changing discount rate. Stock prices are more volatile than bond prices because calculating the present value involves two constantly changing factors - the earnings stream and the discount rate.

The Pricing Process Is (Usually) Rational
 Hopefully you now have a better understanding of why stocks and bonds behave the way they do. This knowledge should place you in a better position to make more informed investment decisions. The pricing of all the thousands and thousands of stocks and bonds is essentially rational. Market participants apply their cumulative knowledge and best estimates as to future inflation, future risks and known or unknown income streams to arrive at present-day valuations. These valuations are constantly fluctuating based on continually changing expectations. In hindsight, one can see that emotions, even in the aggregate, can cause these expectations, and thus valuations, to be incorrect. For the most part, however, they are correct based on what is known at any given point in time.

Conclusion
Bonds will always be less volatile on average than stocks because more is known and certain about their income flow. Over time, stocks should generate greater returns than bonds because there are more unknowns. More unknowns imply greater potential risk. If stocks do not return more, then investors have become truly irrational and taken needless risk with their investment dollars.

Kraft Stares Down A Catch-22

The J. M. Smucker Company (NYSE: SJM) is trading to the upside in the early session today, following a third quarter earnings report that saw the consumer staple maker top views led by a strong surge in coffee sales.

It is common to find investors and writers talk about food companies like Kraft (NYSE:KFT) in the context of "people always have to eat." While that is true, it overlooks a fairly important point - nobody has to eat their food. There is a big difference between food companies like Kraft and Kellogg (NYSE:K) and the likes of ConAgra (NYSE:CAG) and investors should not just lump all food companies into the same basket. While Kraft certainly has a tough environment to navigate and may have indeed overpaid for Cadbury, this is a food company that merits more than casual attention.

The Quarter that Was

All in all, Kraft delivered a quarter that was a little complicated (due to charges and adjustments and the like), but pretty much consistent with expectations. Sales, though, were a bit higher than the analysts expected. On a reported basis, Kraft served up 5.7% organic revenue growth this quarter, or 4.7% if the effect of an extra week in the quarter is subtracted. The legacy business delivered growth of 5.3%, while Cadbury chipped in about 2.2% organic growth.

Looking at profitability, Kraft's story was like so many others this quarter - mixed. The company's gross margin fell by two points and that appears to be worse than most analysts expected, as the analyst community was apparently surprised by the extent of cost inflation in the market. On a more positive note, the company trimmed down operating expenses better than most expected (and the Cadbury integration is ahead of schedule) and recaptured some of that lost margin, as adjusted operating margin ticked up 20 basis points from the year-ago period. Continuing an oddly consistent trend (at least among the large corporations), Kraft reported lower-than-expected taxes and that helped the company meet the earnings-per-share target for the fourth quarter. 

The Road AheadWhile U.S. government officials may not be seeing inflation, Kraft is (remember, things like energy and food input prices apparently are not "real" inflation, so they don't count). To that end, the company lowered guidance for 2011 and talked about input price increases in the high single digits. Although all food companies are in this same boat to some extent, Kraft may have a few extra levers to pull in terms of trimming operating costs and that may help mitigate some of the squeeze. That said, the company is also facing the loss of Starbucks (Nasdaq: SBUX) and that will take some steam out of the results as well.

Kraft also has at least one other factor working in its favor - a broad global presence. In terms of sales, Kraft is near the top of the list of North American food companies that get a sizable percentage of sales from foreign markets. Better still, those markets are growing substantially faster than North America or Western Europe. Is it coincidence that companies like Unilever (NYSE:UL), Coca-Cola (NYSE:KO), Pepsico (NYSE:PEP) and Nestle (Nasdaq:NSRGY) all have solid emerging market exposure and better-than-average returns on capital and growth? Probably not ... and it is a solid argument that Kraft is hanging with the right crowd in that respect.

The Bottom Line

Did Kraft overpay for Cadbury and destroy shareholder value? Maybe so, but it is not readily apparent in the results right now. It may also prove to be the case that Cadbury was a synergistic merger that also expanded Kraft's opportunities in some significant non-U.S. markets. Time will tell.
In the meanwhile, Kraft is going to have to navigate a tricky maze of coping with higher input prices through both restrained price increases and improved internal operating efficiencies. If the company pulls this off, this looks to be one of the better food companies to own. Kraft may not get the benefit of the boom in agriculture (since high prices can actually hurt them more than help) and cost worries might keep a lid on the stock in the short run, but value-oriented investors may find more to like in Kraft shares than they expect.

Disclosure I am Long KFT, UL, PEP, and K shares.

Smucker's Profit Falls 2.6% (SJM); Shares Trade Higher

The J. M. Smucker Company (NYSE: SJM) is trading to the upside in the early session today, following a third quarter earnings report that saw the consumer staple maker top views led by a strong surge in coffee sales.

Smucker reported a net income decrease of 3%, from $135.48 million in Q310 to $132 million this quarter. EPS was $1.27 on an adjusted basis though, compared to $1.17 the preceding year.

Net revs in the quarter were up 9%, from $1.206 billion to $1.312 billion.

Overall, the consensus was looking for EPS of $1.26 and revs of $1.25 billion.

The U.S. retail coffee market led the way, with a 18% jump in sales from $471.5 milllion to $554.7 million. The segment benefited from a 13% price hike through their FY11, which offset a 2% volume decline.

Looking ahead, Smucker sees FY11 sales up 4% from FY10. The company also increased the low-end of its outlook from $4.55 - $4.65 to $4.60 - $4.65. The Street is currently looking for EPS of $4.64.

Shares of SJM are up 3.2% today.


Disclosure I am long SJM shares